Dish Network 2013 Annual Report Download - page 176
Download and view the complete annual report
Please find page 176 of the 2013 Dish Network annual report below. You can navigate through the pages in the report by either clicking on the pages listed below, or by using the keyword search tool below to find specific information within the annual report.-
 1
1 -
2
-
3
-
4
-
5
-
6
-
7
-
8
-
9
-
10
-
11
-
12
-
13
-
14
-
15
-
16
-
17
-
18
-
19
-
20
-
21
-
22
-
23
-
24
-
25
-
26
-
27
-
28
-
29
-
30
-
31
-
32
-
33
-
34
-
35
-
36
-
37
-
38
-
39
-
40
-
41
-
42
-
43
-
44
-
45
-
46
-
47
-
48
-
49
-
50
-
51
-
52
-
53
-
54
-
55
-
56
-
57
-
58
-
59
-
60
-
61
-
62
-
63
-
64
-
65
-
66
-
67
-
68
-
69
-
70
-
71
-
72
-
73
-
74
-
75
-
76
-
77
-
78
-
79
-
80
-
81
-
82
-
83
-
84
-
85
-
86
-
87
-
88
-
89
-
90
-
91
-
92
-
93
-
94
-
95
-
96
-
97
-
98
-
99
-
100
-
101
-
102
-
103
-
104
-
105
-
106
-
107
-
108
-
109
-
110
-
111
-
112
-
113
-
114
-
115
-
116
-
117
-
118
-
119
-
120
-
121
-
122
-
123
-
124
-
125
-
126
-
127
-
128
-
129
-
130
-
131
-
132
-
133
-
134
-
135
-
136
-
137
-
138
-
139
-
140
-
141
-
142
-
143
-
144
-
145
-
146
-
147
-
148
-
149
-
150
-
151
-
152
-
153
-
154
-
155
-
156
-
157
-
158
-
159
-
160
-
161
-
162
-
163
-
164
-
165
-
 166
166 -
 167
167 -
 168
168 -
 169
169 -
 170
170 -
 171
171 -
 172
172 -
 173
173 -
 174
174 -
 175
175 -
 176
176 -
 177
177 -
 178
178 -
 179
179 -
 180
180 -
 181
181 -
 182
182 -
 183
183 -
 184
184 -
 185
185 -
 186
186 -
187
-
188
-
189
-
190
-
191
-
192
 |
 |

DISH NETWORK CORPORATION
NOTES TO CONSOLIDATED FINANCIAL STATEMENTS - Continued
F-66
Geographic Information. Revenues are attributed to geographic regions based upon the location where the
products are delivered and services are provided. All revenue from continuing operations were in the United States.
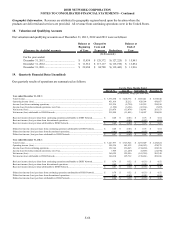
18. Valuation and Qualifying Accounts
Our valuation and qualifying accounts as of December 31, 2013, 2012 and 2011 were as follows:
Allowance for doubtful accounts
Balance at
Beginning
of Year
Charged to
Costs and
Expenses Deductions
Balance at
End of
Year
For the years ended:
December 31, 2013............................................. 13,834$ 129,37 2$ (127,225)$ 15,981$
December 31, 2012............................................. 11,916$ 117,11 7$ (115,199)$ 13,834$
December 31, 2011............................................. 29,650$ 94,709$ (112,443)$ 11,916$
(In thousands)
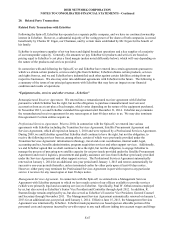
19. Quarterly Financial Data (Unaudited)
Our quarterly results of operations are summarized as follows:
March 31 June 30 September 30 December 31
Year ended December 31, 2013:
Total revenue.............................................................................................................................................. 3,375,530$ 3,485,774$ 3,505,021$ 3,53 8,5 40$
Operating income (loss)............................................................................................................................. 451,616 25,212 420,394 450,957
Income (loss) from continuing operations.................................................................................................. 212,234 (8,720) 343,325 290,250
Income (loss) from discontinued operations, net of tax.............................................................................. (1,558) (6,354) (32,334) (7,097)
Net income (loss)....................................................................................................................................... 210,676 (15,074) 310,991 283,153
Net income (loss) attributable to DISH Network....................................................................................... 215,598 (11,051) 314,907 288,038
Basic net income (loss) per share from continuing operations attributable to DISH Network................... 0.48$ (0.01)$ 0.76$ 0.64$
Basic net income (loss) per share from discontinued operations................................................................ - (0.01) (0.07) (0.01)
Basic net income (loss) per share attributable to DISH Network............................................................... 0.48$ (0.02)$ 0.69$ 0.63$
Diluted net income (loss) per share from continuing operations attributable to DISH Network................ 0.48$ (0.01)$ 0.75$ 0.64$
Diluted net income (loss) per share from discontinued operations............................................................. (0.01) (0.01) (0.07) (0.01)
Diluted net income (loss) per share attributable to DISH Network............................................................ 0.47$ (0.02)$ 0.68$ 0.63$
Year ended December 31, 2012:
Total revenue.............................................................................................................................................. 3,247,977$ 3,318,924$ 3,293,609$ 3,32 0,8 24$
Operating income (loss)............................................................................................................................. 558,334 481,932 (260,183) 478,275
Income (loss) from continuing operations.................................................................................................. 352,166 236,865 (154,430) 228,318
Income (loss) from discontinued operations, net of tax.............................................................................. 7,959 (11,269) (8,899) (24,970)
Net income (loss)....................................................................................................................................... 360,125 225,596 (163,329) 203,348
Net income (loss) attributable to DISH Network....................................................................................... 360,310 225,732 (158,461) 209,106
Basic net income (loss) per share from continuing operations attributable to DISH Network................... 0.79$ 0.52$ (0.33)$ 0.52$
Basic net income (loss) per share from discontinued operations................................................................ 0.02 (0.02) (0.02) (0.06)
Basic net income (loss) per share attributable to DISH Network............................................................... 0.81$ 0.50$ (0.35)$ 0.46$
Diluted net income (loss) per share from continuing operations attributable to DISH Network................ 0.78$ 0.52$ (0.33)$ 0.52$
Diluted net income (loss) per share from discontinued operations............................................................. 0.02 (0.02) (0.02) (0.06)
Diluted net income (loss) per share attributable to DISH Network............................................................ 0.80$ 0.50$ (0.35)$ 0.46$
(In thousands, except per share data)
For the Three Months Ended