Dish Network 2013 Annual Report Download - page 158
Download and view the complete annual report
Please find page 158 of the 2013 Dish Network annual report below. You can navigate through the pages in the report by either clicking on the pages listed below, or by using the keyword search tool below to find specific information within the annual report.-
 1
1 -
2
-
3
-
4
-
5
-
6
-
7
-
8
-
9
-
10
-
11
-
12
-
13
-
14
-
15
-
16
-
17
-
18
-
19
-
20
-
21
-
22
-
23
-
24
-
25
-
26
-
27
-
28
-
29
-
30
-
31
-
32
-
33
-
34
-
35
-
36
-
37
-
38
-
39
-
40
-
41
-
42
-
43
-
44
-
45
-
46
-
47
-
48
-
49
-
50
-
51
-
52
-
53
-
54
-
55
-
56
-
57
-
58
-
59
-
60
-
61
-
62
-
63
-
64
-
65
-
66
-
67
-
68
-
69
-
70
-
71
-
72
-
73
-
74
-
75
-
76
-
77
-
78
-
79
-
80
-
81
-
82
-
83
-
84
-
85
-
86
-
87
-
88
-
89
-
90
-
91
-
92
-
93
-
94
-
95
-
96
-
97
-
98
-
99
-
100
-
101
-
102
-
103
-
104
-
105
-
106
-
107
-
108
-
109
-
110
-
111
-
112
-
113
-
114
-
115
-
116
-
117
-
118
-
119
-
120
-
121
-
122
-
123
-
124
-
125
-
126
-
127
-
128
-
129
-
130
-
131
-
132
-
133
-
134
-
135
-
136
-
137
-
138
-
139
-
140
-
141
-
142
-
143
-
144
-
145
-
146
-
147
-
 148
148 -
 149
149 -
 150
150 -
 151
151 -
 152
152 -
 153
153 -
 154
154 -
 155
155 -
 156
156 -
 157
157 -
 158
158 -
 159
159 -
 160
160 -
 161
161 -
 162
162 -
 163
163 -
 164
164 -
 165
165 -
 166
166 -
 167
167 -
 168
168 -
169
-
170
-
171
-
172
-
173
-
174
-
175
-
176
-
177
-
178
-
179
-
180
-
181
-
182
-
183
-
184
-
185
-
186
-
187
-
188
-
189
-
190
-
191
-
192
 |
 |

DISH NETWORK CORPORATION
NOTES TO CONSOLIDATED FINANCIAL STATEMENTS - Continued
F-48
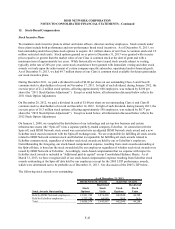
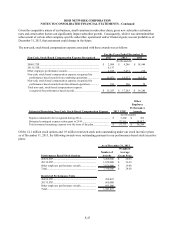
Stock-Based Compensation
During the years ended December 31, 2013 and 2012, we incurred an initial charge related to vested options of $5
million and $14 million, respectively, of additional non-cash, stock-based compensation expense in connection with
the 2012 Stock Option Adjustment and the 2011 Stock Option Adjustment discussed previously. These amounts
are included in the table below. Total non-cash, stock-based compensation expense for all of our employees is
shown in the following table for the years ended December 31, 2013, 2012 and 2011 and was allocated to the same
expense categories as the base compensation for such employees:
2013 2012 2011
Subscriber-related....................................................................................... 1,947$ 1,607$ 1,91 4$
General and administrative.......................................................................... 27,783 37,720 29,299
Non-cash, stock-based compensation from continuing operations.............. 29,730 39,327 31,213
Non-cash, stock-based compensation from discontinued operations.......... 925 1,643 308
Total non-cash, stock-based compensation ................................................ 30,655$ 40,970$ 31,521$
For the Y ears Ended December 31,
(In thousands)
As of December 31, 2013, our total unrecognized compensation cost related to our non-performance based unvested
stock awards was $12 million. This cost was based on an estimated future forfeiture rate of approximately 3.7% per
year and will be recognized over a weighted-average period of approximately two years. Share-based compensation
expense is recognized based on stock awards ultimately expected to vest and is reduced for estimated forfeitures.
Forfeitures are estimated at the time of grant and revised, if necessary, in subsequent periods if actual forfeitures
differ from those estimates. Changes in the estimated forfeiture rate can have a significant effect on share-based
compensation expense since the effect of adjusting the rate is recognized in the period the forfeiture estimate is
changed.
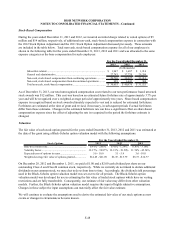
Valuation
The fair value of each stock option granted for the years ended December 31, 2013, 2012 and 2011 was estimated at
the date of the grant using a Black-Scholes option valuation model with the following assumptions:
Stock Options 2013 2012 2011
Risk-free interest rate.......................................................... 0.91% - 2.66% 0.41% - 1.29% 0.36% - 3.18%
Volatility factor.................................................................. 32.37% - 39.87% 33.15% - 39.50% 31.74% - 45.56%
Expected term of options in years....................................... 5.6 - 10.0 3.1 - 5.9 3.6 - 10.0
Weighted-average fair value of options granted................. $14.49 - $21.09 $6.72 - $13.79 $8.73 - $14.77
For the Years Ended December 31,
On December 28, 2012 and December 1, 2011, we paid a $1.00 and a $2.00 cash dividend per share on our
outstanding Class A and Class B common stock, respectively. While we currently do not intend to declare additional
dividends on our common stock, we may elect to do so from time to time. Accordingly, the dividend yield percentage
used in the Black-Scholes option valuation model was set at zero for all periods. The Black-Scholes option
valuation model was developed for use in estimating the fair value of traded stock options which have no vesting
restrictions and are fully transferable. Consequently, our estimate of fair value may differ from other valuation
models. Further, the Black-Scholes option valuation model requires the input of highly subjective assumptions.
Changes in these subjective input assumptions can materially affect the fair value estimate.
We will continue to evaluate the assumptions used to derive the estimated fair value of our stock options as new
events or changes in circumstances become known.