Dish Network 2013 Annual Report Download - page 129
Download and view the complete annual report
Please find page 129 of the 2013 Dish Network annual report below. You can navigate through the pages in the report by either clicking on the pages listed below, or by using the keyword search tool below to find specific information within the annual report.-
 1
1 -
2
-
3
-
4
-
5
-
6
-
7
-
8
-
9
-
10
-
11
-
12
-
13
-
14
-
15
-
16
-
17
-
18
-
19
-
20
-
21
-
22
-
23
-
24
-
25
-
26
-
27
-
28
-
29
-
30
-
31
-
32
-
33
-
34
-
35
-
36
-
37
-
38
-
39
-
40
-
41
-
42
-
43
-
44
-
45
-
46
-
47
-
48
-
49
-
50
-
51
-
52
-
53
-
54
-
55
-
56
-
57
-
58
-
59
-
60
-
61
-
62
-
63
-
64
-
65
-
66
-
67
-
68
-
69
-
70
-
71
-
72
-
73
-
74
-
75
-
76
-
77
-
78
-
79
-
80
-
81
-
82
-
83
-
84
-
85
-
86
-
87
-
88
-
89
-
90
-
91
-
92
-
93
-
94
-
95
-
96
-
97
-
98
-
99
-
100
-
101
-
102
-
103
-
104
-
105
-
106
-
107
-
108
-
109
-
110
-
111
-
112
-
113
-
114
-
115
-
116
-
117
-
118
-
 119
119 -
 120
120 -
 121
121 -
 122
122 -
 123
123 -
 124
124 -
 125
125 -
 126
126 -
 127
127 -
 128
128 -
 129
129 -
 130
130 -
 131
131 -
 132
132 -
 133
133 -
 134
134 -
 135
135 -
 136
136 -
 137
137 -
 138
138 -
 139
139 -
140
-
141
-
142
-
143
-
144
-
145
-
146
-
147
-
148
-
149
-
150
-
151
-
152
-
153
-
154
-
155
-
156
-
157
-
158
-
159
-
160
-
161
-
162
-
163
-
164
-
165
-
166
-
167
-
168
-
169
-
170
-
171
-
172
-
173
-
174
-
175
-
176
-
177
-
178
-
179
-
180
-
181
-
182
-
183
-
184
-
185
-
186
-
187
-
188
-
189
-
190
-
191
-
192
 |
 |

DISH NETWORK CORPORATION
NOTES TO CONSOLIDATED FINANCIAL STATEMENTS - Continued
F-19
Fair Value Election. As of December 31, 2013, our ARS and other noncurrent marketable investment securities
portfolio of $134 million included $89 million of securities accounted for under the fair value method.
Other Investment Securities
We have strategic investments in certain debt and equity securities that are included in noncurrent “Marketable and
other investment securities” on our Consolidated Balance Sheets and accounted for using the cost, equity and/or fair
value methods of accounting.
Our ability to realize value from our strategic investments in companies that are not publicly traded depends on the
success of those companies’ businesses and their ability to obtain sufficient capital, on acceptable terms or at all,
and to execute their business plans. Because private markets are not as liquid as public markets, there is also
increased risk that we will not be able to sell these investments, or that when we desire to sell them we will not be
able to obtain fair value for them.
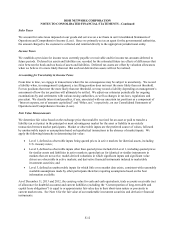
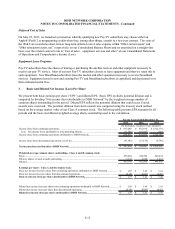
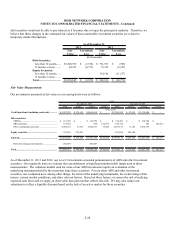
Unrealized Gains (Losses) on Marketable Investment Securities
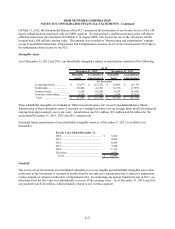
As of December 31, 2013 and 2012, we had accumulated net unrealized gains of $181 million and $207 million,
respectively. These amounts, net of related tax effect, were $178 million and $194 million, respectively. All of these
amounts are included in “Accumulated other comprehensive income (loss)” within “Total stockholders’ equity
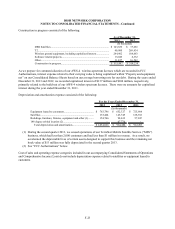
(deficit).” The components of our available-for-sale investments are summarized in the table below.
Marketable Marketable
Investment Investment
Securities Gains Losses Net Securities Gains Losses Net
Debt securities:
VRDNs................................... 116,570$ -$ -$ -$ 130,306$ -$ -$ -$
ARS and other........................ 45,030 1,188 (5,138) (3,950) 43,921 1,375 (8,033) (6,658)
ARS fair value election.......... 88,622 - - - 62,251 - - -
Other (including restricted).... 4,668,532 83,363 (4,741) 78,622 3,287,317 208,208 (1,203) 207,005
Equity securities....................... 335,651 106,684 - 106,684 265,380 17,918 (11,537) 6,381
Total.......................................... 5,254,405$ 191,235$ (9,879)$ 181,356$ 3,789,175$ 227,501$ (20,773)$ 206,728$
As of December 31,
(In thousands)
Unrealized
2013
Unrealized
2012
As of December 31, 2013, restricted and non-restricted marketable investment securities include debt securities of
$4.340 billion with contractual maturities within one year, $359 million with contractual maturities extending longer
than one year through and including five years, $2 million with contractual maturities extending longer than five
years through and including ten years and $218 million with contractual maturities longer than ten years. Actual
maturities may differ from contractual maturities as a result of our ability to sell these securities prior to maturity.
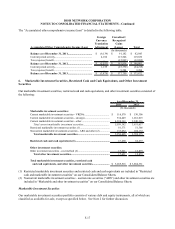
Marketable Investment Securities in a Loss Position
The following table reflects the length of time that the individual securities, accounted for as available-for-sale, have
been in an unrealized loss position, aggregated by investment category. As of December 31, 2012, the unrealized
losses on our investments in equity securities represented investments in broad-based indexes and companies in the
telecommunications and technology industries. We are not aware of any specific factors which indicate the
unrealized losses in these investments are due to anything other than temporary market fluctuations. As of
December 31, 2013 and 2012, the unrealized losses on our investments in debt securities primarily represented
investments in ARS and corporate bonds. We have the ability to hold and do not intend to sell our investments in
these debt securities before they recover or mature, and it is more likely than not that we will hold these investments
until that time. In addition, we are not aware of any specific factors indicating that the underlying issuers of these