Dish Network 2013 Annual Report Download - page 83
Download and view the complete annual report
Please find page 83 of the 2013 Dish Network annual report below. You can navigate through the pages in the report by either clicking on the pages listed below, or by using the keyword search tool below to find specific information within the annual report.-
 1
1 -
2
-
3
-
4
-
5
-
6
-
7
-
8
-
9
-
10
-
11
-
12
-
13
-
14
-
15
-
16
-
17
-
18
-
19
-
20
-
21
-
22
-
23
-
24
-
25
-
26
-
27
-
28
-
29
-
30
-
31
-
32
-
33
-
34
-
35
-
36
-
37
-
38
-
39
-
40
-
41
-
42
-
43
-
44
-
45
-
46
-
47
-
48
-
49
-
50
-
51
-
52
-
53
-
54
-
55
-
56
-
57
-
58
-
59
-
60
-
61
-
62
-
63
-
64
-
65
-
66
-
67
-
68
-
69
-
70
-
71
-
72
-
 73
73 -
 74
74 -
 75
75 -
 76
76 -
 77
77 -
 78
78 -
 79
79 -
 80
80 -
 81
81 -
 82
82 -
 83
83 -
 84
84 -
 85
85 -
 86
86 -
 87
87 -
 88
88 -
 89
89 -
 90
90 -
 91
91 -
 92
92 -
 93
93 -
94
-
95
-
96
-
97
-
98
-
99
-
100
-
101
-
102
-
103
-
104
-
105
-
106
-
107
-
108
-
109
-
110
-
111
-
112
-
113
-
114
-
115
-
116
-
117
-
118
-
119
-
120
-
121
-
122
-
123
-
124
-
125
-
126
-
127
-
128
-
129
-
130
-
131
-
132
-
133
-
134
-
135
-
136
-
137
-
138
-
139
-
140
-
141
-
142
-
143
-
144
-
145
-
146
-
147
-
148
-
149
-
150
-
151
-
152
-
153
-
154
-
155
-
156
-
157
-
158
-
159
-
160
-
161
-
162
-
163
-
164
-
165
-
166
-
167
-
168
-
169
-
170
-
171
-
172
-
173
-
174
-
175
-
176
-
177
-
178
-
179
-
180
-
181
-
182
-
183
-
184
-
185
-
186
-
187
-
188
-
189
-
190
-
191
-
192
 |
 |

Item 7. MANAGEMENT’S DISCUSSION AND ANALYSIS OF FINANCIAL CONDITION AND
RESULTS OF OPERATIONS - Continued
73
73
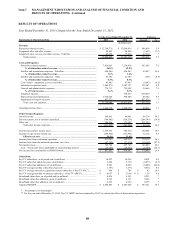
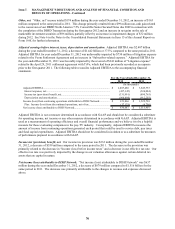
Year Ended December 31, 2012 Compared to the Year Ended December 31, 2011.
For the Years Ended December 31, Variance
Statements of Operations Data 2012 2011 Amount %
Revenue:
Subscriber-related revenue................................................................................................. 13,064,936$ 12,972,152$ 92,784$ 0.7
Equipment sales and other revenue..................................................................................... 98,480 65,437 33,043 50.5
Equipment sales, services and other revenue - EchoStar.................................................... 17,918 36,474 (18,556) (50.9)
Total revenue............................................................................................................... 13,181,334 13,074,063 107,271 0.8
Costs and Expenses:
Subscriber-related expenses............................................................................................. 7,254,458 6,845,611 408,847 6.0
% of Subscriber-related revenue........................................................................... 55.5% 52.8%
Satellite and transmission expenses - EchoStar............................................................... 424,543 441,541 (16,998) (3.8)
% of Subscriber-related revenue........................................................................... 3.2% 3.4%
Satellite and transmission expenses - Other..................................................................... 41,697 39,806 1,891 4.8
% of Subscriber-related revenue........................................................................... 0.3% 0.3%
Cost of sales - equipment, services and other ................................................................. 97,965 80,372 17,593 21.9
Subscriber acquisition costs............................................................................................. 1,687,327 1,505,131 182,196 12.1
General and administrative expenses............................................................................... 722,045 637,365 84,680 13.3
% of Total revenue................................................................................................. 5.5% 4.9%
Litigation expense............................................................................................................ 730,457 (316,949) 1,047,406 *
Depreciation and amortization......................................................................................... 964,484 912,203 52,281 5.7
Total costs and expenses.............................................................................................. 11,922,976 10,145,080 1,777,896 17.5
Operating income (loss)...................................................................................................... 1,258,358 2,928,983 (1,670,625) (57.0)
Other Income (Expense):
Interest income.................................................................................................................... 99,091 33,882 65,209 *
Interest expense, net of amounts capitalized....................................................................... (536,236) (557,966) 21,730 3.9
Other, net............................................................................................................................ 173,697 8,240 165,457 *
Total other income (expense)...................................................................................... (263,448) (515,844) 252,396 48.9
Income (loss) before income taxes...................................................................................... 994,910 2,413,139 (1,418,229) (58.8)
Income tax (provision) benefit, net..................................................................................... (331,991) (890,765) 558,774 62.7
Effective tax rate....................................................................................................... 33.4% 36.9%
Income (loss) from continuing operations.......................................................................... 662,919 1,522,374 (859,455) (56.5)
Income (loss) from discontinued operations, net of tax...................................................... (37,179) (6,796) (30,383) *
Net income (loss)................................................................................................................ 625,740 1,515,578 (889,838) (58.7)
Less: Net income (loss) attributable to noncontrolling interest..................................... (10,947) (329) (10,618) *
Net income (loss) attributable to DISH Network................................................................ 636,687$ 1,515,907$ (879,220)$ (58.0)
Other Data:
Pay-TV subscribers, as of period end (in millions)............................................................. 14.056 13.967 0.089 0.6
Pay-TV subscriber additions, gross (in millions)................................................................ 2.739 2.576 0.163 6.3
Pay-TV subscriber additions, net (in millions)................................................................... 0.089 (0.166) 0.255 *
Pay-TV average monthly subscriber churn rate.................................................................. 1.57% 1.63% (0.06%) (3.7)
Pay-TV average subscriber acquisition cost per subscriber (“Pay-TV SAC”)................... 784$ 770$ 14$ 1.8
Pay-TV average monthly revenue per subscriber (“Pay-TV ARPU”)............................... 76.98$ ** 76.43$ ** 0.55$ 0.7
Broadband subscribers, as of period end (in millions)........................................................ 0.183 0.105 0.078 74.3
Broadband subscriber additions, gross (in millions)........................................................... 0.121 0.030 0.091 *
Broadband subscriber additions, net (in millions).............................................................. 0.078 (0.005) 0.083 *
Adjusted EBITDA.............................................................................................................. 2,407,486$ 3,849,755$ (1,442,269)$ (37.5)
* Percentage is not meaningful.
** For the years ended December 31, 2012 and 2011, Pay-TV ARPU has been adjusted by $0.12 and $0.02, respectively,
to exclude the effect of discontinued operations.
(In thousands)