Dish Network 2011 Annual Report Download - page 73
Download and view the complete annual report
Please find page 73 of the 2011 Dish Network annual report below. You can navigate through the pages in the report by either clicking on the pages listed below, or by using the keyword search tool below to find specific information within the annual report.-
 1
1 -
2
-
3
-
4
-
5
-
6
-
7
-
8
-
9
-
10
-
11
-
12
-
13
-
14
-
15
-
16
-
17
-
18
-
19
-
20
-
21
-
22
-
23
-
24
-
25
-
26
-
27
-
28
-
29
-
30
-
31
-
32
-
33
-
34
-
35
-
36
-
37
-
38
-
39
-
40
-
41
-
42
-
43
-
44
-
45
-
46
-
47
-
48
-
49
-
50
-
51
-
52
-
53
-
54
-
55
-
56
-
57
-
58
-
59
-
60
-
61
-
62
-
 63
63 -
 64
64 -
 65
65 -
 66
66 -
 67
67 -
 68
68 -
 69
69 -
 70
70 -
 71
71 -
 72
72 -
 73
73 -
 74
74 -
 75
75 -
 76
76 -
 77
77 -
 78
78 -
 79
79 -
 80
80 -
 81
81 -
 82
82 -
 83
83 -
84
-
85
-
86
-
87
-
88
-
89
-
90
-
91
-
92
-
93
-
94
-
95
-
96
-
97
-
98
-
99
-
100
-
101
-
102
-
103
-
104
-
105
-
106
-
107
-
108
-
109
-
110
-
111
-
112
-
113
-
114
-
115
-
116
-
117
-
118
-
119
-
120
-
121
-
122
-
123
-
124
-
125
-
126
-
127
-
128
-
129
-
130
-
131
-
132
-
133
-
134
-
135
-
136
-
137
-
138
-
139
-
140
-
141
-
142
-
143
-
144
-
145
-
146
-
147
-
148
-
149
-
150
-
151
-
152
-
153
-
154
-
155
-
156
-
157
-
158
-
159
-
160
-
161
-
162
-
163
-
164
 |
 |

Item 7. MANAGEMENT’S DISCUSSION AND ANALYSIS OF FINANCIAL CONDITION AND
RESULTS OF OPERATIONS - Continued
63
63
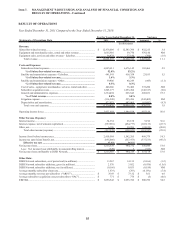
The following discussion highlights our cash flow activities during the years ended December 31, 2011, 2010 and
2009.
Free Cash Flow
We define free cash flow as “Net cash flows from operating activities” less “Purchases of property and equipment,”
as shown on our Consolidated Statements of Cash Flows. We believe free cash flow is an important liquidity metric
because it measures, during a given period, the amount of cash generated that is available to repay debt obligations,
make investments, fund acquisitions and for certain other activities. Free cash flow is not a measure determined in
accordance with GAAP and should not be considered a substitute for “Operating income,” “Net income,” “Net cash
flows from operating activities” or any other measure determined in accordance with GAAP. Since free cash flow
includes investments in operating assets, we believe this non-GAAP liquidity measure is useful in addition to the
most directly comparable GAAP measure “Net cash flows from operating activities.”
During the years ended December 31, 2011, 2010 and 2009, free cash flow was significantly impacted by changes in
operating assets and liabilities and in “Purchases of property and equipment” as shown in the “Net cash flows from
operating activities” and “Net cash flows from investing” sections, respectively, of our Consolidated Statements of
Cash Flows included herein. Operating asset and liability balances can fluctuate significantly from period to period and
there can be no assurance that free cash flow will not be negatively impacted by material changes in operating assets
and liabilities in future periods, since these changes depend upon, among other things, management’s timing of
payments and control of inventory levels, and cash receipts. In addition to fluctuations resulting from changes in
operating assets and liabilities, free cash flow can vary significantly from period to period depending upon, among
other things, subscriber growth, subscriber revenue, subscriber churn, subscriber acquisition costs including amounts
capitalized under our equipment lease programs, operating efficiencies, increases or decreases in purchases of property
and equipment, and other factors.
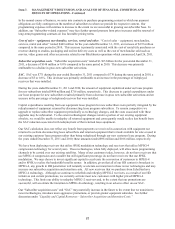
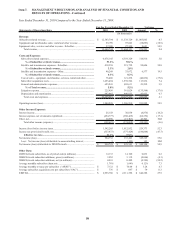
The following table reconciles free cash flow to “Net cash flows from operating activities.”
2011 2010 2009
Free cash flow........................................................... 1,794,973$ 923,670$ 1,157,353$
Add back:
Purchases of property and equipment................... 778,905 1,216,132 1,037,190
Net cash flows from operating activities................... 2,573,878$ 2,139,802$ 2,194,543$
For the Years Ended December 31,
(In thousands)
The increase in free cash flow from 2010 to 2011 of $871 million resulted from an increase in “Net cash flows from
operating activities” of $434 million and a decrease in “Purchases of property and equipment” of $437 million. The
increase in “Net cash flows from operating activities” was primarily attributable to a $895 million increase in cash
resulting from net income, adjusted to exclude non-cash changes in “Deferred tax expense (benefit),” and
“Depreciation and amortization” expense, partially offset by a $502 million decrease in cash resulting from changes in
operating assets and liabilities. The decrease in cash resulting from changes in operating assets and liabilities is
principally attributable to timing differences between book expense and cash payments and $350 million in payments
for the TiVo and Retailer Class Action settlements. The decrease in “Purchases of property and equipment” in 2011
was primarily attributable to a decrease in satellite construction and a decline in expenditures for equipment under our
lease programs for new and existing subscribers of $241 million.
On December 17, 2010, the Tax Relief, Unemployment Insurance Reauthorization and Job Creation Act of 2010
was enacted, which provides for a bonus depreciation deduction of 100% of the cost of our qualified capital
expenditures from September 8, 2010 through December 31, 2011. During the year ended December 31, 2011, our
“Deferred income tax expense (benefit)” recorded as a non-cash adjustment to net income on our Consolidated
Statements of Cash Flows increased $427 million compared to the same period in 2010. This change is primarily
associated with equipment-related temporary differences as a result of bonus depreciation deductions available in
2011.