Dish Network 2011 Annual Report Download - page 130
Download and view the complete annual report
Please find page 130 of the 2011 Dish Network annual report below. You can navigate through the pages in the report by either clicking on the pages listed below, or by using the keyword search tool below to find specific information within the annual report.-
 1
1 -
2
-
3
-
4
-
5
-
6
-
7
-
8
-
9
-
10
-
11
-
12
-
13
-
14
-
15
-
16
-
17
-
18
-
19
-
20
-
21
-
22
-
23
-
24
-
25
-
26
-
27
-
28
-
29
-
30
-
31
-
32
-
33
-
34
-
35
-
36
-
37
-
38
-
39
-
40
-
41
-
42
-
43
-
44
-
45
-
46
-
47
-
48
-
49
-
50
-
51
-
52
-
53
-
54
-
55
-
56
-
57
-
58
-
59
-
60
-
61
-
62
-
63
-
64
-
65
-
66
-
67
-
68
-
69
-
70
-
71
-
72
-
73
-
74
-
75
-
76
-
77
-
78
-
79
-
80
-
81
-
82
-
83
-
84
-
85
-
86
-
87
-
88
-
89
-
90
-
91
-
92
-
93
-
94
-
95
-
96
-
97
-
98
-
99
-
100
-
101
-
102
-
103
-
104
-
105
-
106
-
107
-
108
-
109
-
110
-
111
-
112
-
113
-
114
-
115
-
116
-
117
-
118
-
119
-
 120
120 -
 121
121 -
 122
122 -
 123
123 -
 124
124 -
 125
125 -
 126
126 -
 127
127 -
 128
128 -
 129
129 -
 130
130 -
 131
131 -
 132
132 -
 133
133 -
 134
134 -
 135
135 -
 136
136 -
 137
137 -
 138
138 -
 139
139 -
 140
140 -
141
-
142
-
143
-
144
-
145
-
146
-
147
-
148
-
149
-
150
-
151
-
152
-
153
-
154
-
155
-
156
-
157
-
158
-
159
-
160
-
161
-
162
-
163
-
164
 |
 |

DISH NETWORK CORPORATION
NOTES TO CONSOLIDATED FINANCIAL STATEMENTS - Continued
F-36
Ciel II. Ciel II, a Canadian DBS satellite, was launched in December 2008 and commenced commercial operation
during February 2009. This satellite is accounted for as a capital lease and depreciated over the term of the satellite
service agreement. We have leased 100% of the capacity on Ciel II for an initial 10 year term.
As of December 31, 2011 and 2010, we had $500 million capitalized for the estimated fair value of satellites acquired
under capital leases included in “Property and equipment, net,” with related accumulated depreciation of $151 million
and $109 million, respectively. In our Consolidated Statements of Operations and Comprehensive Income (Loss), we
recognized $43 million, $43 million and $40 million in depreciation expense on satellites acquired under capital lease
agreements during the years ended December 31, 2011, 2010 and 2009, respectively.
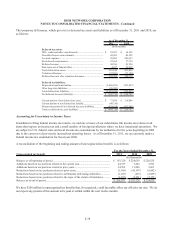
Future minimum lease payments under the capital lease obligation, together with the present value of the net minimum
lease payments as of December 31, 2011 are as follows (in thousands):
For the Years Ended December 31,
2012.............................................................................................................................................................. 84,715$
2013.............................................................................................................................................................. 77,893
2014.............................................................................................................................................................. 76,296
2015.............................................................................................................................................................. 75,970
2016.............................................................................................................................................................. 75,970
Thereafter...................................................................................................................................................... 314,269
Total minimum lease payments..................................................................................................................... 705,113
Less: Amount representing lease of the orbital location and estimated executory costs (primarily
insurance and maintenance) including profit thereon, included in total minimum lease payments............. (323,382)
Net minimum lease payments....................................................................................................................... 381,731
Less: Amount representing interest.............................................................................................................. (109,823)
Present value of net minimum lease payments.............................................................................................. 271,908
Less: Current portion................................................................................................................................... (29,202)
Long-term portion of capital lease obligations.............................................................................................. 242,706$
The summary of future maturities of our outstanding long-term debt as of December 31, 2011 is included in the
commitments table in Note 16.
12. Income Taxes and Accounting for Uncertainty in Income Taxes
Income Taxes
Our income tax policy is to record the estimated future tax effects of temporary differences between the tax bases of assets
and liabilities and amounts reported on our Consolidated Balance Sheets, as well as probable operating loss, tax credit and
other carryforwards. Deferred tax assets are offset by valuation allowances when we believe it is more likely than not
that net deferred tax assets will not be realized. We periodically evaluate our need for a valuation allowance. Determining
necessary valuation allowances requires us to make assessments about historical financial information as well as the timing
of future events, including the probability of expected future taxable income and available tax planning opportunities.
We file consolidated tax returns in the U.S. The income taxes of domestic and foreign subsidiaries not included in the U.S.
tax group are presented in our consolidated financial statements based on a separate return basis for each tax paying entity.
As of December 31, 2011, we had no net operating loss carryforwards (“NOLs”) for federal income tax purposes and $13
million of NOL benefit for state income tax purposes. The state NOLs begin to expire in the year 2020. In addition, there
are $5 million of tax benefits related to credit carryforwards which are partially offset by a valuation allowance and $14
million benefit of capital loss carryforwards which are fully offset by a valuation allowance. The credit carryforwards begin
to expire in the year 2012.