Dish Network 2011 Annual Report Download - page 153
Download and view the complete annual report
Please find page 153 of the 2011 Dish Network annual report below. You can navigate through the pages in the report by either clicking on the pages listed below, or by using the keyword search tool below to find specific information within the annual report.-
 1
1 -
2
-
3
-
4
-
5
-
6
-
7
-
8
-
9
-
10
-
11
-
12
-
13
-
14
-
15
-
16
-
17
-
18
-
19
-
20
-
21
-
22
-
23
-
24
-
25
-
26
-
27
-
28
-
29
-
30
-
31
-
32
-
33
-
34
-
35
-
36
-
37
-
38
-
39
-
40
-
41
-
42
-
43
-
44
-
45
-
46
-
47
-
48
-
49
-
50
-
51
-
52
-
53
-
54
-
55
-
56
-
57
-
58
-
59
-
60
-
61
-
62
-
63
-
64
-
65
-
66
-
67
-
68
-
69
-
70
-
71
-
72
-
73
-
74
-
75
-
76
-
77
-
78
-
79
-
80
-
81
-
82
-
83
-
84
-
85
-
86
-
87
-
88
-
89
-
90
-
91
-
92
-
93
-
94
-
95
-
96
-
97
-
98
-
99
-
100
-
101
-
102
-
103
-
104
-
105
-
106
-
107
-
108
-
109
-
110
-
111
-
112
-
113
-
114
-
115
-
116
-
117
-
118
-
119
-
120
-
121
-
122
-
123
-
124
-
125
-
126
-
127
-
128
-
129
-
130
-
131
-
132
-
133
-
134
-
135
-
136
-
137
-
138
-
139
-
140
-
141
-
142
-
 143
143 -
 144
144 -
 145
145 -
 146
146 -
 147
147 -
 148
148 -
 149
149 -
 150
150 -
 151
151 -
 152
152 -
 153
153 -
 154
154 -
 155
155 -
 156
156 -
 157
157 -
 158
158 -
 159
159 -
 160
160 -
 161
161 -
 162
162 -
 163
163 -
164
 |
 |

DISH NETWORK CORPORATION
NOTES TO CONSOLIDATED FINANCIAL STATEMENTS - Continued
F-59
Geographic Information. Revenues are attributed to geographic regions based upon the location where the goods
and services are provided. During the year ended December 31, 2011, our international revenue includes
transactions with customers in United Kingdom, Mexico and Denmark totaling $242 million, $117 million and $45
million, respectively.
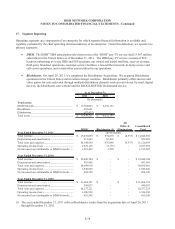
18. Valuation and Qualifying Accounts
Our valuation and qualifying accounts as of December 31, 2011, 2010 and 2009 are as follows:
Allowance for doubtful accounts
Balance at
Beginning
of Year
Charged to
Costs and
Expenses Deductions
Balance at
End of
Year
For the years ended:
December 31, 2011............................................. 29,650$ 100,321$ (117,621)$ 12,350$
December 31, 2010............................................. 16,372$ 115,478$ (102,200)$ 29,650$
December 31, 2009............................................. 15,207$ 112,025$ (110,860)$ 16,372$
(In thousands)
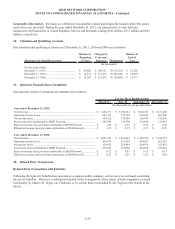
19. Quarterly Financial Data (Unaudited)
Our quarterly results of operations are summarized as follows:
March 31 June 30 September 30 December 31
Year ended December 31, 2011:
Total revenue.................................................................................................. 3,224,131$ 3,590,161$ 3,602,651$ 3,631,450$
Operating income (loss).................................................................................. 983,353 717,782 624,839 601,980
Net income (loss)............................................................................................ 549,326 334,838 318,978 312,436
Net income (loss) attributable to DISH Network............................................ 549,394 334,760 319,099 312,654
Basic net income (loss) per share attributable to DISH Network.................... 1.24$ 0.75$ 0.72$ 0.70$
Diluted net income (loss) per share attributable to DISH Network................. 1.22$ 0.75$ 0.71$ 0.70$
Year ended December 31, 2010:
Total revenue.................................................................................................. 3,057,395$ 3,169,042$ 3,207,728$ 3,206,579$
Operating income (loss).................................................................................. 456,979 525,810 454,657 503,382
Net income (loss)............................................................................................ 230,915 256,984 244,978 251,855
Net income (loss) attributable to DISH Network............................................ 230,947 256,990 244,964 251,828
Basic net income (loss) per share attributable to DISH Network.................... 0.52$ 0.57$ 0.55$ 0.57$
Diluted net income (loss) per share attributable to DISH Network................. 0.52$ 0.57$ 0.55$ 0.56$
(In thousands, except per share data)
For the Three Months Ended
20. Related Party Transactions
Related Party Transactions with EchoStar
Following the Spin-off, EchoStar has operated as a separate public company, and we have no continued ownership
interest in EchoStar. However, a substantial majority of the voting power of the shares of both companies is owned
beneficially by Charles W. Ergen, our Chairman, or by certain trusts established by Mr. Ergen for the benefit of his
family.