Dish Network 2011 Annual Report Download - page 72
Download and view the complete annual report
Please find page 72 of the 2011 Dish Network annual report below. You can navigate through the pages in the report by either clicking on the pages listed below, or by using the keyword search tool below to find specific information within the annual report.-
 1
1 -
2
-
3
-
4
-
5
-
6
-
7
-
8
-
9
-
10
-
11
-
12
-
13
-
14
-
15
-
16
-
17
-
18
-
19
-
20
-
21
-
22
-
23
-
24
-
25
-
26
-
27
-
28
-
29
-
30
-
31
-
32
-
33
-
34
-
35
-
36
-
37
-
38
-
39
-
40
-
41
-
42
-
43
-
44
-
45
-
46
-
47
-
48
-
49
-
50
-
51
-
52
-
53
-
54
-
55
-
56
-
57
-
58
-
59
-
60
-
61
-
 62
62 -
 63
63 -
 64
64 -
 65
65 -
 66
66 -
 67
67 -
 68
68 -
 69
69 -
 70
70 -
 71
71 -
 72
72 -
 73
73 -
 74
74 -
 75
75 -
 76
76 -
 77
77 -
 78
78 -
 79
79 -
 80
80 -
 81
81 -
 82
82 -
83
-
84
-
85
-
86
-
87
-
88
-
89
-
90
-
91
-
92
-
93
-
94
-
95
-
96
-
97
-
98
-
99
-
100
-
101
-
102
-
103
-
104
-
105
-
106
-
107
-
108
-
109
-
110
-
111
-
112
-
113
-
114
-
115
-
116
-
117
-
118
-
119
-
120
-
121
-
122
-
123
-
124
-
125
-
126
-
127
-
128
-
129
-
130
-
131
-
132
-
133
-
134
-
135
-
136
-
137
-
138
-
139
-
140
-
141
-
142
-
143
-
144
-
145
-
146
-
147
-
148
-
149
-
150
-
151
-
152
-
153
-
154
-
155
-
156
-
157
-
158
-
159
-
160
-
161
-
162
-
163
-
164
 |
 |

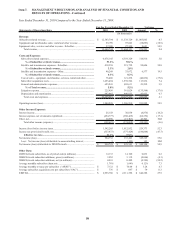
Item 7. MANAGEMENT’S DISCUSSION AND ANALYSIS OF FINANCIAL CONDITION AND
RESULTS OF OPERATIONS - Continued
62
62
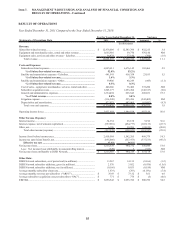
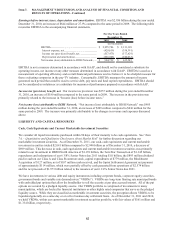
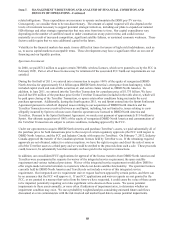
Earnings before interest, taxes, depreciation and amortization. EBITDA was $2.956 billion during the year ended
December 31, 2010, an increase of $644 million or 27.9% compared to the same period in 2009. The following table
reconciles EBITDA to the accompanying financial statements.
2010 2009
EBITDA.................................................................... 2,955,786$ 2,311,398$
Interest expense, net................................................. (429,619) (358,391)
Income tax (provision) benefit, net.......................... (557,473) (377,429)
Depreciation and amortization................................. (983,965) (940,033)
Net income (loss) attributable to DISH Network....... 984,729$ 635,545$
For the Years Ended
December 31,
(In thousands)
EBITDA is not a measure determined in accordance with GAAP, and should not be considered a substitute for
operating income, net income or any other measure determined in accordance with GAAP. EBITDA is used as a
measurement of operating efficiency and overall financial performance and we believe it to be a helpful measure for
those evaluating companies in the pay-TV industry. Conceptually, EBITDA measures the amount of income
generated each period that could be used to service debt, pay taxes and fund capital expenditures. EBITDA should
not be considered in isolation or as a substitute for measures of performance prepared in accordance with GAAP.
Income tax (provision) benefit, net. Our income tax provision was $557 million during the year ended December
31, 2010, an increase of $180 million compared to the same period in 2009. The increase in the provision was
primarily related to the increase in “Income (loss) before income taxes.”
Net income (loss) attributable to DISH Network. “Net income (loss) attributable to DISH Network” was $985
million during the year ended December 31, 2010, an increase of $349 million compared to $636 million for the
same period in 2009. The increase was primarily attributable to the changes in revenue and expenses discussed
above.
LIQUIDITY AND CAPITAL RESOURCES
Cash, Cash Equivalents and Current Marketable Investment Securities
We consider all liquid investments purchased within 90 days of their maturity to be cash equivalents. See “Item
7A. – Quantitative and Qualitative Disclosures About Market Risk” for further discussion regarding our
marketable investment securities. As of December 31, 2011, our cash, cash equivalents and current marketable
investment securities totaled $2.041 billion compared to $2.940 billion as of December 31, 2010, a decrease of
$899 million. This decrease in cash, cash equivalents and current marketable investment securities was primarily
related to our investment in DBSD North America of $1.139 billion, the TerreStar Transaction of $1.345 billion,
repurchases and redemptions of our 6 3/8% Senior Notes due 2011 totaling $1.0 billion, the $893 million dividend
paid in cash on our Class A and Class B common stock, capital expenditures of $779 million, the Blockbuster
Acquisition of $127 million, net of $107 million cash received, and the Sprint Settlement Agreement net payment
of approximately $114 million, which were partially offset by cash generated from operations of $2.574 billion
and the net proceeds of $1.973 billion related to the issuance of our 6 3/4% Senior Notes due 2021.
We have investments in various debt and equity instruments including corporate bonds, corporate equity securities,
government bonds and variable rate demand notes (“VRDNs”). VRDNs are long-term floating rate municipal bonds
with embedded put options that allow the bondholder to sell the security at par plus accrued interest. All of the put
options are secured by a pledged liquidity source. Our VRDN portfolio is comprised of investments in many
municipalities, which are backed by financial institutions or other highly rated companies that serve as the pledged
liquidity source. While they are classified as marketable investment securities, the put option allows VRDNs to be
liquidated generally on a same day or on a five business day settlement basis. As of December 31, 2011 and 2010,
we held VRDNs, within our current marketable investment securities portfolio, with fair values of $161 million and
$1.334 billion, respectively.