Dish Network 2011 Annual Report Download - page 70
Download and view the complete annual report
Please find page 70 of the 2011 Dish Network annual report below. You can navigate through the pages in the report by either clicking on the pages listed below, or by using the keyword search tool below to find specific information within the annual report.-
 1
1 -
2
-
3
-
4
-
5
-
6
-
7
-
8
-
9
-
10
-
11
-
12
-
13
-
14
-
15
-
16
-
17
-
18
-
19
-
20
-
21
-
22
-
23
-
24
-
25
-
26
-
27
-
28
-
29
-
30
-
31
-
32
-
33
-
34
-
35
-
36
-
37
-
38
-
39
-
40
-
41
-
42
-
43
-
44
-
45
-
46
-
47
-
48
-
49
-
50
-
51
-
52
-
53
-
54
-
55
-
56
-
57
-
58
-
59
-
 60
60 -
 61
61 -
 62
62 -
 63
63 -
 64
64 -
 65
65 -
 66
66 -
 67
67 -
 68
68 -
 69
69 -
 70
70 -
 71
71 -
 72
72 -
 73
73 -
 74
74 -
 75
75 -
 76
76 -
 77
77 -
 78
78 -
 79
79 -
 80
80 -
81
-
82
-
83
-
84
-
85
-
86
-
87
-
88
-
89
-
90
-
91
-
92
-
93
-
94
-
95
-
96
-
97
-
98
-
99
-
100
-
101
-
102
-
103
-
104
-
105
-
106
-
107
-
108
-
109
-
110
-
111
-
112
-
113
-
114
-
115
-
116
-
117
-
118
-
119
-
120
-
121
-
122
-
123
-
124
-
125
-
126
-
127
-
128
-
129
-
130
-
131
-
132
-
133
-
134
-
135
-
136
-
137
-
138
-
139
-
140
-
141
-
142
-
143
-
144
-
145
-
146
-
147
-
148
-
149
-
150
-
151
-
152
-
153
-
154
-
155
-
156
-
157
-
158
-
159
-
160
-
161
-
162
-
163
-
164
 |
 |
Item 7. MANAGEMENT’S DISCUSSION AND ANALYSIS OF FINANCIAL CONDITION AND
RESULTS OF OPERATIONS - Continued
60
60
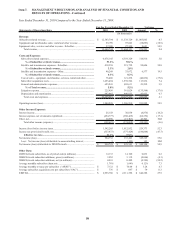
DISH subscribers. As of December 31, 2010, we had approximately 14.133 million DISH subscribers compared to
approximately 14.100 million subscribers at December 31, 2009, an increase of 0.2%. During the year ended
December 31, 2010, DISH added approximately 3.052 million gross new subscribers compared to approximately
3.118 million gross new subscribers during the same period in 2009, a decrease of 2.1%. Our gross activations in
2010 were negatively impacted relative to 2009 by increased competitive pressures, including the aggressive
marketing and the effectiveness of certain competitors’ promotional offers, which included an increased level of
discounts. DISH added approximately 33,000 net new subscribers during the year ended December 31, 2010,
compared to approximately 422,000 net new subscribers during the same period in 2009. This decrease primarily
resulted from increased churn.
Our average monthly subscriber churn rate for the year ended December 31, 2010 was 1.76%, compared to 1.64%
for the same period in 2009. Churn increased during the year as a result of the increasingly competitive nature of
our industry, the current economic conditions, multiple programming interruptions related to contract disputes with
several content providers during the fourth quarter of 2010, and our 2010 price increases. In general, our churn rate
is impacted by the quality of subscribers acquired in past quarters, our ability to provide strong customer service,
and our ability to control piracy. Historically, we have experienced slightly higher churn in the months following
the expiration of commitments for new subscribers. In February 2008, we extended our new subscriber commitment
from 18 to 24 months. Consequently, during the second half of 2009, churn was positively impacted by, among
other things, this increase in our new subscriber commitment period.
Subscriber-related revenue. DISH “Subscriber-related revenue” totaled $12.544 billion for the year ended December
31, 2010, an increase of $1.005 billion or 8.7% compared to the same period in 2009. This change was primarily
related to the increase in “ARPU” discussed below as well as a larger average subscriber base during the year ended
December 31, 2010 compared to the same period in 2009.
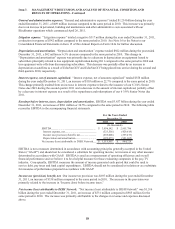
ARPU. “Average monthly revenue per subscriber” was $73.32 during the year ended December 31, 2010 versus
$70.04 during the same period in 2009. The $3.28 or 4.7% increase in ARPU was primarily attributable to price
increases in February and June 2010 and changes in the sales mix toward more advanced hardware offerings.
ARPU increased as a result of higher hardware related fees which include rental fees, fees earned from our in-home
service operations, and fees for DVRs. This increase was partially offset by increases in the amount of promotional
discounts on programming offered to our new subscribers.
Equipment and merchandise sales, rental and other revenue. “Equipment and merchandise sales, rental and other
revenue” totaled $60 million during the year ended December 31, 2010, a decrease of $38 million or 38.9% compared
to the same period in 2009. The decrease in “Equipment sales and other revenue” primarily resulted from a decline in
the sales of non-subsidized DBS receivers and accessories, and digital converter boxes in 2010 compared to the same
period in 2009.
Subscriber-related expenses. “Subscriber-related expenses” totaled $6.676 billion during the year ended December
31, 2010, an increase of $317 million or 5.0% compared to the same period in 2009. The increase in “Subscriber-
related expenses” was primarily attributable to higher programming costs. The increase in programming costs was
driven by rate increases in certain of our programming contracts, including the renewal of certain contracts at higher
rates and by a larger average subscriber base. This increase was partially offset by reduced costs related to our call
centers, customer retention, and in-home service operations. We continue to address our operational inefficiencies
by streamlining our hardware offerings and making significant investments in staffing, training, information systems
and other initiatives, primarily in our call centers and in-home service operations. “Subscriber-related expenses”
represented 53.2% and 55.1% of “Subscriber-related revenue” during the years ended December 31, 2010 and 2009,
respectively. The improvement in this expense to revenue ratio primarily resulted from an increase in “Subscriber-
related revenue” and the reduced costs discussed above, partially offset by higher programming costs.
Satellite and transmission expenses – EchoStar. “Satellite and transmission expenses – EchoStar” totaled $418
million during the year ended December 31, 2010, an increase of $99 million or 30.8% compared to the same period in
2009. The increase in “Satellite and transmission expenses – EchoStar” is related to an increase in transponder
capacity leased from EchoStar primarily related to the Nimiq 5 satellite, which was placed into service in October
2009, an increase in monthly lease rates per transponder on certain satellites based on the terms of our amended lease
agreements and the increase in uplink services. The increase in uplink services was primarily attributable to the launch