Crucial 2011 Annual Report Download - page 10
Download and view the complete annual report
Please find page 10 of the 2011 Crucial annual report below. You can navigate through the pages in the report by either clicking on the pages listed below, or by using the keyword search tool below to find specific information within the annual report.-
 1
1 -
 2
2 -
 3
3 -
 4
4 -
 5
5 -
 6
6 -
 7
7 -
 8
8 -
 9
9 -
 10
10 -
 11
11 -
 12
12 -
 13
13 -
 14
14 -
 15
15 -
 16
16 -
 17
17 -
 18
18 -
 19
19 -
 20
20 -
 21
21 -
22
-
23
-
24
-
25
-
26
-
27
-
28
-
29
-
30
-
31
-
32
-
33
-
34
-
35
-
36
-
37
-
38
-
39
-
40
-
41
-
42
-
43
-
44
-
45
-
46
-
47
-
48
-
49
-
50
-
51
-
52
-
53
-
54
-
55
-
56
-
57
-
58
-
59
-
60
-
61
-
62
-
63
-
64
-
65
-
66
-
67
-
68
-
69
-
70
-
71
-
72
-
73
-
74
-
75
-
76
-
77
-
78
-
79
-
80
-
81
-
82
-
83
-
84
-
85
-
86
-
87
-
88
-
89
-
90
-
91
-
92
-
93
-
94
-
95
-
96
-
97
-
98
-
99
-
100
-
101
-
102
-
103
-
104
-
105
-
106
-
107
-
108
-
109
-
110
-
111
-
112
-
113
-
114
-
115
-
116
-
117
-
118
-
119
-
120
-
121
-
122
-
123
-
124
-
125
-
126
-
127
-
128
-
129
-
130
-
131
-
132
-
133
-
134
-
135
-
136
-
137
-
138
-
139
-
140
-
141
-
142
-
143
-
144
-
145
-
146
-
147
-
148
-
149
-
150
-
151
-
152
-
153
-
154
-
155
-
156
-
157
-
158
-
159
-
160
-
161
-
162
-
163
-
164
-
165
-
166
-
167
-
168
-
169
-
170
-
171
-
172
-
173
-
174
-
175
-
176
-
177
-
178
-
179
-
180
-
181
-
182
-
183
-
184
-
185
-
186
-
187
-
188
-
189
-
190
-
191
-
192
-
193
-
194
-
195
-
196
-
197
-
198
-
199
-
200
-
201
-
202
-
203
-
204
 |
 |

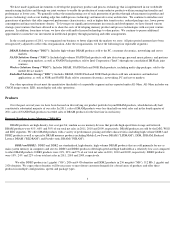
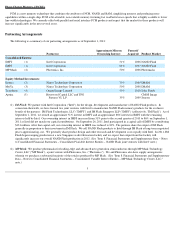
Competition
We face intense competition in the semiconductor memory markets from a number of companies, including Elpida Memory, Inc.; Hynix
Semiconductor Inc.; Samsung Electronics Co., Ltd; SanDisk Corporation; Spansion Inc. and Toshiba Corporation. Some of our competitors are
large corporations or conglomerates that may have greater resources to withstand downturns in the semiconductor markets in which we compete,
invest in technology and capitalize on growth opportunities. Our competitors seek to increase silicon capacity, improve yields, reduce die size and
minimize mask levels in their product designs resulting in significantly increased worldwide supply and downward pressure on prices. Many of
our high-volume memory products are manufactured to industry standard specifications, and as such, have similar performance characteristics to
our competitors. For these high-volume memory products, the principal competitive factors are generally price and performance characteristics
including: operating speed, power consumption, reliability, compatibility, size and form factors. For our other memory products, the
aforementioned performance characteristics generally take precedent to pricing.
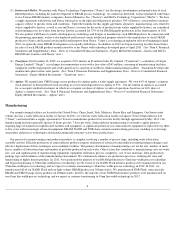
Research and Development
Our process technology research and development ("R&D") efforts are focused primarily on development of successively smaller line-width
process technologies, which are designed to facilitate our transition to next generation memory products. Additional process technology R&D
efforts focus on advanced computing and mobile memory architectures, the investigation of new opportunities that leverage our core
semiconductor expertise and the development of new manufacturing materials. Product design and development efforts are concentrated on our
high density DDR3 DRAM and LP-DDR2 mobile LPDRAM products as well as high density and mobile NAND Flash memory (including multi-
level cell technology), NOR Flash memory, specialty memory, PCM and other next-generation memories and memory systems.
Our R&D expenses were $791 million, $624 million and $647 million in 2011, 2010 and 2009, respectively. We generally share R&D
process and design costs for NAND Flash equally with Intel and for DRAM equally with Nanya. As a result of reimbursements under our NAND
Flash and DRAM cost sharing arrangements with our joint venture partners, our overall R&D expenses were reduced by $236 million, $155
million and $107 million in 2011, 2010 and 2009, respectively.
To compete in the semiconductor memory industry, we must continue to develop technologically advanced products and processes. We
believe that expansion of our semiconductor product offerings is necessary to meet expected market demand for specific memory solutions. Our
process development center and largest design center are located at our corporate headquarters in Boise, Idaho. In 2011, we began construction of
a new 450mm-wafer capable R&D facility in Boise which we expect will be ready for tool installations in the beginning of calendar year 2012.
We have several additional product design centers in other strategic locations around the world. In addition, we develop leading edge
photolithography mask technology at our MP Mask joint venture facility in Boise.
R&D expenses vary primarily with the number of development wafers processed, the cost of advanced equipment dedicated to new product
and process development, and personnel costs. Because of the lead times necessary to manufacture our products, we typically begin to process
wafers before completion of performance and reliability testing. We deem development of a product complete once the product has been
thoroughly reviewed and tested for performance and reliability. R&D expenses can vary significantly depending on the timing of product
qualification.
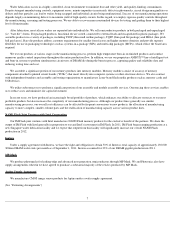
Geographic Information
Sales to customers outside the United States totaled $7.4 billion for 2011 and included $3.0 billion in sales to China, $924 million in sales to
Europe, $744 million in sales to Taiwan, $737 million in sales to Malaysia and $1.5 billion in sales to the rest of the Asia Pacific region (excluding
China, Malaysia and Taiwan). Sales to customers outside the United States totaled $7.1 billion for 2010 and $3.9 billion for 2009. As of
September 1, 2011, we had net property, plant and equipment of $3.6 billion in Singapore, $3.5 billion in the United States, $190 million in Italy,
$179 million in China, $94 million in Israel, and $36 million in other countries. (See "Item 8. Financial Statements and Supplementary Data –
Notes to Consolidated Financial Statements
– Geographic Information" note and "Item 1A. Risk Factors.")
9