ComEd 2015 Annual Report Download - page 87
Download and view the complete annual report
Please find page 87 of the 2015 ComEd annual report below. You can navigate through the pages in the report by either clicking on the pages listed below, or by using the keyword search tool below to find specific information within the annual report.-
 1
1 -
2
-
3
-
4
-
5
-
6
-
7
-
8
-
9
-
10
-
11
-
12
-
13
-
14
-
15
-
16
-
17
-
18
-
19
-
20
-
21
-
22
-
23
-
24
-
25
-
26
-
27
-
28
-
29
-
30
-
31
-
32
-
33
-
34
-
35
-
36
-
37
-
38
-
39
-
40
-
41
-
42
-
43
-
44
-
45
-
46
-
47
-
48
-
49
-
50
-
51
-
52
-
53
-
54
-
55
-
56
-
57
-
58
-
59
-
60
-
61
-
62
-
63
-
64
-
65
-
66
-
67
-
68
-
69
-
70
-
71
-
72
-
73
-
74
-
75
-
76
-
 77
77 -
 78
78 -
 79
79 -
 80
80 -
 81
81 -
 82
82 -
 83
83 -
 84
84 -
 85
85 -
 86
86 -
 87
87 -
 88
88 -
 89
89 -
 90
90 -
 91
91 -
 92
92 -
 93
93 -
 94
94 -
 95
95 -
 96
96 -
 97
97 -
98
-
99
-
100
-
101
-
102
-
103
-
104
-
105
-
106
-
107
-
108
-
109
-
110
-
111
-
112
-
113
-
114
-
115
-
116
-
117
-
118
-
119
-
120
-
121
-
122
-
123
-
124
-
125
-
126
-
127
-
128
-
129
-
130
-
131
-
132
-
133
-
134
-
135
-
136
-
137
-
138
-
139
-
140
-
141
-
142
-
143
-
144
-
145
-
146
-
147
-
148
-
149
-
150
-
151
-
152
-
153
-
154
-
155
-
156
-
157
-
158
-
159
-
160
-
161
-
162
-
163
-
164
-
165
-
166
-
167
-
168
-
169
-
170
-
171
-
172
-
173
-
174
-
175
-
176
-
177
-
178
-
179
-
180
-
181
-
182
-
183
-
184
-
185
-
186
-
187
-
188
-
189
-
190
-
191
-
192
-
193
-
194
-
195
-
196
-
197
-
198
-
199
-
200
-
201
-
202
-
203
-
204
-
205
-
206
-
207
-
208
-
209
-
210
-
211
-
212
-
213
-
214
-
215
-
216
-
217
-
218
-
219
-
220
-
221
-
222
-
223
-
224
-
225
-
226
-
227
-
228
-
229
-
230
-
231
-
232
-
233
-
234
-
235
-
236
-
237
-
238
-
239
-
240
-
241
-
242
-
243
-
244
-
245
-
246
-
247
-
248
-
249
-
250
-
251
-
252
-
253
-
254
-
255
-
256
-
257
-
258
-
259
-
260
-
261
-
262
-
263
-
264
-
265
-
266
-
267
-
268
-
269
-
270
-
271
-
272
-
273
-
274
-
275
-
276
-
277
-
278
-
279
-
280
-
281
-
282
-
283
-
284
-
285
-
286
-
287
-
288
-
289
-
290
-
291
-
292
-
293
-
294
-
295
-
296
-
297
-
298
-
299
-
300
-
301
-
302
-
303
-
304
-
305
-
306
-
307
-
308
-
309
-
310
-
311
-
312
-
313
-
314
-
315
-
316
-
317
-
318
-
319
-
320
-
321
-
322
-
323
-
324
-
325
-
326
-
327
-
328
-
329
-
330
-
331
-
332
-
333
-
334
-
335
-
336
-
337
-
338
-
339
-
340
-
341
-
342
-
343
-
344
-
345
-
346
-
347
-
348
-
349
-
350
-
351
-
352
-
353
-
354
-
355
-
356
-
357
-
358
-
359
-
360
-
361
-
362
-
363
-
364
-
365
-
366
-
367
-
368
-
369
-
370
-
371
-
372
-
373
-
374
-
375
-
376
-
377
-
378
-
379
-
380
-
381
-
382
-
383
-
384
-
385
-
386
-
387
-
388
-
389
-
390
-
391
-
392
-
393
-
394
-
395
-
396
-
397
-
398
-
399
-
400
-
401
-
402
-
403
-
404
-
405
-
406
-
407
-
408
-
409
-
410
-
411
-
412
-
413
-
414
-
415
-
416
-
417
-
418
-
419
-
420
-
421
-
422
-
423
-
424
-
425
-
426
-
427
-
428
-
429
-
430
-
431
-
432
-
433
-
434
-
435
-
436
-
437
-
438
-
439
-
440
-
441
-
442
-
443
-
444
-
445
-
446
-
447
-
448
-
449
-
450
-
451
-
452
-
453
-
454
-
455
-
456
-
457
-
458
-
459
-
460
-
461
-
462
-
463
-
464
-
465
-
466
-
467
-
468
-
469
-
470
-
471
-
472
-
473
-
474
-
475
-
476
-
477
-
478
-
479
-
480
-
481
-
482
-
483
-
484
-
485
-
486
-
487
-
488
-
489
-
490
-
491
-
492
-
493
-
494
-
495
-
496
-
497
-
498
-
499
-
500
-
501
-
502
-
503
-
504
-
505
-
506
-
507
-
508
-
509
-
510
-
511
-
512
-
513
-
514
-
515
-
516
-
517
-
518
-
519
-
520
-
521
-
522
-
523
-
524
-
525
-
526
-
527
-
528
-
529
-
530
-
531
-
532
-
533
-
534
-
535
-
536
-
537
-
538
-
539
-
540
-
541
-
542
-
543
-
544
-
545
-
546
-
547
-
548
-
549
-
550
-
551
-
552
-
553
-
554
-
555
-
556
-
557
-
558
-
559
-
560
-
561
-
562
-
563
-
564
-
565
-
566
-
567
-
568
-
569
-
570
-
571
-
572
-
573
-
574
-
575
-
576
-
577
-
578
-
579
-
580
-
581
-
582
-
583
-
584
-
585
-
586
-
587
-
588
-
589
-
590
-
591
-
592
-
593
-
594
-
595
-
596
-
597
-
598
-
599
-
600
-
601
-
602
-
603
-
604
-
605
-
606
-
607
-
608
-
609
-
610
-
611
-
612
-
613
-
614
-
615
-
616
-
617
-
618
-
619
-
620
-
621
-
622
-
623
-
624
-
625
-
626
-
627
-
628
-
629
-
630
-
631
-
632
-
633
-
634
-
635
-
636
-
637
-
638
-
639
-
640
-
641
-
642
-
643
-
644
-
645
-
646
-
647
-
648
-
649
-
650
-
651
-
652
-
653
-
654
-
655
-
656
-
657
-
658
-
659
-
660
-
661
-
662
-
663
 |
 |
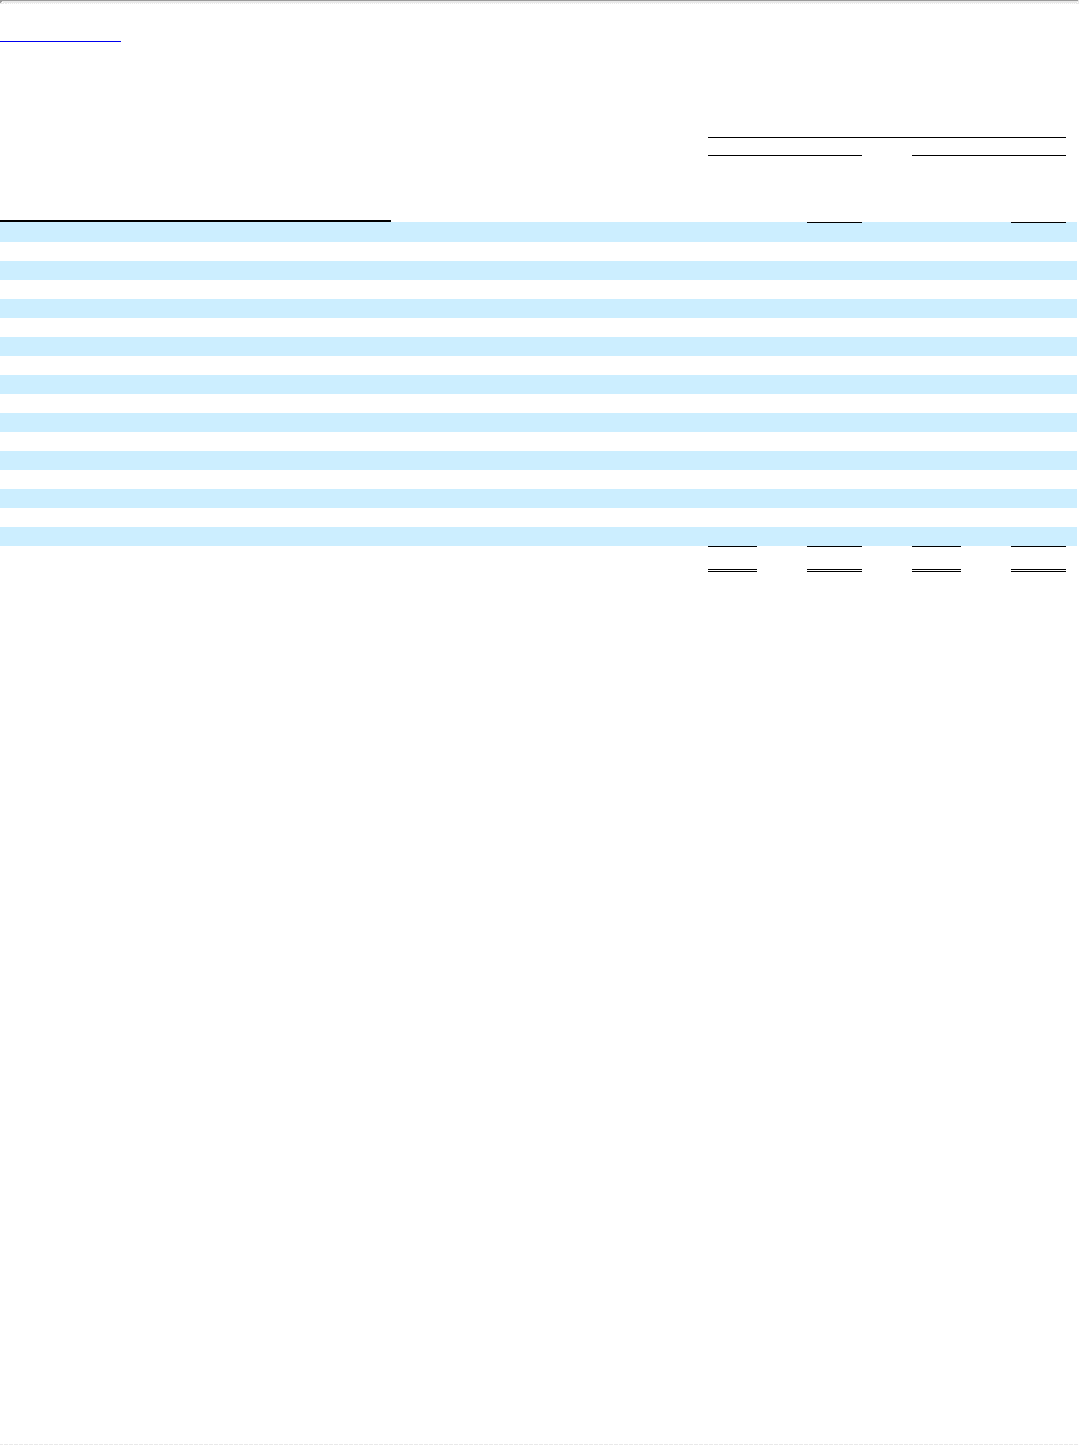
Table of Contents
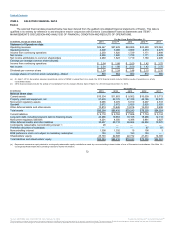
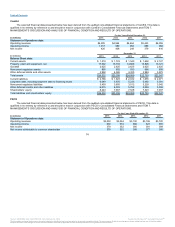
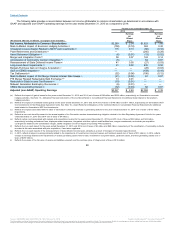
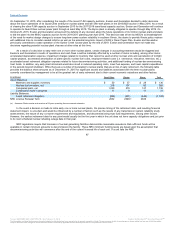
The following table provides a reconciliation between net income attributable to common shareholders as determined in accordance with
GAAP and adjusted (non-GAAP) operating earnings for the year ended December 31, 2015 as compared to 2014:
For the years ended December 31,
2015 2014
(All amounts after tax; in millions, except per share amounts)
Earnings
per
Diluted
Share
Earnings
per
Diluted
Share
Net Income Attributable to Common Shareholders $2,269 $ 2.54 $1,623 $ 1.88
Mark-to-Market Impact of Economic Hedging Activities (158) (0.18) 363 0.42
Unrealized Losses (Gains) Related to NDT Fund Investments 115 0.13 (86) (0.10)
Plant Retirements and Divestitures — — (245) (0.28)
Asset Retirement Obligation (6) (0.01) (13) (0.02)
Merger and Integration Costs 58 0.07 124 0.14
Amortization of Commodity Contract Intangibles (5) — 64 0.07
Reassessment of State Deferred Income Taxes 41 0.05 (27) (0.03)
Long-Lived Asset Impairments 21 0.02 435 0.50
Bargain-Purchase Gain on Integrys Acquisition — — (28) (0.03)
Gain on CENG Integration — — (159) (0.18)
Tax Settlements (52) (0.06) (106) (0.12)
Mark-to-Market Impact of PHI Merger Related Interest Rate Swaps (21) (0.02) 61 0.07
PHI Merger Related Redeemable Debt Exchange 13 0.01 — —
Reduction in State Income Tax Reserve (10) (0.01) — —
Midwest Generation Bankruptcy Recoveries (6) (0.01) — —
CENG Non-Controlling Interest (32) (0.04) 62 0.07
Adjusted (non-GAAP) Operating Earnings $2,227 $ 2.49 $2,068 $ 2.39
(a) Reflects the impact of (gains) losses for the years ended December 31, 2015 and 2014 (net of taxes of $99 million and $232 million, respectively) on Generation’s economic
hedging activities. See Note 13—Derivative Financial Instruments of the Combined Notes to Consolidated Financial Statements for additional detail related to Generation’s
hedging activities.
(b) Reflects the impact of unrealized losses (gains) for the years ended December 31, 2015 and 2014 (net of taxes of $148 million and $77 million, respectively) on Generation’s NDT
fund investments for Non-Regulatory Agreement Units. See Note 16—Asset Retirement Obligations of the Combined Notes to Consolidated Financial Statements for additional
detail related to Generation’s NDT fund investments.
(c) Reflects the impacts associated with the sales of Generation’s ownership interests in generating stations for the year ended December 31, 2014 (net of taxes of $163 million,
respectively).
(d) Reflects a non-cash benefit pursuant to the annual update of the Generation nuclear decommissioning obligation related to the Non-Regulatory Agreement Units for the years
ended December 31, 2015 and 2014 (net of taxes of $4 million).
(e) Reflects certain costs associated with mergers and acquisitions incurred for the years ended December 31, 2015 and 2014 (net of taxes of $38 million and $45 million,
respectively) including professional fees, employee-related expenses, integration activities, upfront credit facilities fees, merger commitments, and certain pre-acquisition
contingencies related to the Constellation merger, CENG integration and the Integrys and pending PHI acquisitions.
(f) Reflects the non-cash impact for the years ended December 31, 2015 and 2014 (net of taxes of $3 million and $68 million, respectively) of the amortization of commodity contracts
recorded at fair value associated with prior acquisitions, if and when applicable.
(g) Reflects the non-cash impacts of the remeasurement of state deferred income taxes, primarily as a result of changes in forecasted apportionment.
(h) In 2015, reflects charges to earnings primarily related to the impairments of investments in long-term leases and Upstream assets (net of taxes of $13 million). In 2014, reflects
charges to earnings related to the impairments of certain generating assets held for sale, investment in long-term leases, Upstream assets, and wind generating assets (net of
taxes of $250 million).
(i) Reflects the excess of the fair value of assets and liabilities acquired over the purchase price of Integrys (net of taxes of $16 million).
80
(a)
(b)
(c)
(d)
(e)
(f)
(g)
(h)
(i)
(j)
(k)
(l)
(m)
(n)
(o)
(p)
Source: BALTIMORE GAS & ELECTRIC CO, 10-K, February 10, 2016 Powered by Morningstar® Document Research℠
The information contained herein may not be copied, adapted or distributed and is not warranted to be accurate, complete or timely. The user assumes all risks for any damages or losses arising from any use of this information,
except to the extent such damages or losses cannot be limited or excluded by applicable law. Past financial performance is no guarantee of future results.