ComEd 2015 Annual Report Download - page 127
Download and view the complete annual report
Please find page 127 of the 2015 ComEd annual report below. You can navigate through the pages in the report by either clicking on the pages listed below, or by using the keyword search tool below to find specific information within the annual report.-
 1
1 -
2
-
3
-
4
-
5
-
6
-
7
-
8
-
9
-
10
-
11
-
12
-
13
-
14
-
15
-
16
-
17
-
18
-
19
-
20
-
21
-
22
-
23
-
24
-
25
-
26
-
27
-
28
-
29
-
30
-
31
-
32
-
33
-
34
-
35
-
36
-
37
-
38
-
39
-
40
-
41
-
42
-
43
-
44
-
45
-
46
-
47
-
48
-
49
-
50
-
51
-
52
-
53
-
54
-
55
-
56
-
57
-
58
-
59
-
60
-
61
-
62
-
63
-
64
-
65
-
66
-
67
-
68
-
69
-
70
-
71
-
72
-
73
-
74
-
75
-
76
-
77
-
78
-
79
-
80
-
81
-
82
-
83
-
84
-
85
-
86
-
87
-
88
-
89
-
90
-
91
-
92
-
93
-
94
-
95
-
96
-
97
-
98
-
99
-
100
-
101
-
102
-
103
-
104
-
105
-
106
-
107
-
108
-
109
-
110
-
111
-
112
-
113
-
114
-
115
-
116
-
 117
117 -
 118
118 -
 119
119 -
 120
120 -
 121
121 -
 122
122 -
 123
123 -
 124
124 -
 125
125 -
 126
126 -
 127
127 -
 128
128 -
 129
129 -
 130
130 -
 131
131 -
 132
132 -
 133
133 -
 134
134 -
 135
135 -
 136
136 -
 137
137 -
138
-
139
-
140
-
141
-
142
-
143
-
144
-
145
-
146
-
147
-
148
-
149
-
150
-
151
-
152
-
153
-
154
-
155
-
156
-
157
-
158
-
159
-
160
-
161
-
162
-
163
-
164
-
165
-
166
-
167
-
168
-
169
-
170
-
171
-
172
-
173
-
174
-
175
-
176
-
177
-
178
-
179
-
180
-
181
-
182
-
183
-
184
-
185
-
186
-
187
-
188
-
189
-
190
-
191
-
192
-
193
-
194
-
195
-
196
-
197
-
198
-
199
-
200
-
201
-
202
-
203
-
204
-
205
-
206
-
207
-
208
-
209
-
210
-
211
-
212
-
213
-
214
-
215
-
216
-
217
-
218
-
219
-
220
-
221
-
222
-
223
-
224
-
225
-
226
-
227
-
228
-
229
-
230
-
231
-
232
-
233
-
234
-
235
-
236
-
237
-
238
-
239
-
240
-
241
-
242
-
243
-
244
-
245
-
246
-
247
-
248
-
249
-
250
-
251
-
252
-
253
-
254
-
255
-
256
-
257
-
258
-
259
-
260
-
261
-
262
-
263
-
264
-
265
-
266
-
267
-
268
-
269
-
270
-
271
-
272
-
273
-
274
-
275
-
276
-
277
-
278
-
279
-
280
-
281
-
282
-
283
-
284
-
285
-
286
-
287
-
288
-
289
-
290
-
291
-
292
-
293
-
294
-
295
-
296
-
297
-
298
-
299
-
300
-
301
-
302
-
303
-
304
-
305
-
306
-
307
-
308
-
309
-
310
-
311
-
312
-
313
-
314
-
315
-
316
-
317
-
318
-
319
-
320
-
321
-
322
-
323
-
324
-
325
-
326
-
327
-
328
-
329
-
330
-
331
-
332
-
333
-
334
-
335
-
336
-
337
-
338
-
339
-
340
-
341
-
342
-
343
-
344
-
345
-
346
-
347
-
348
-
349
-
350
-
351
-
352
-
353
-
354
-
355
-
356
-
357
-
358
-
359
-
360
-
361
-
362
-
363
-
364
-
365
-
366
-
367
-
368
-
369
-
370
-
371
-
372
-
373
-
374
-
375
-
376
-
377
-
378
-
379
-
380
-
381
-
382
-
383
-
384
-
385
-
386
-
387
-
388
-
389
-
390
-
391
-
392
-
393
-
394
-
395
-
396
-
397
-
398
-
399
-
400
-
401
-
402
-
403
-
404
-
405
-
406
-
407
-
408
-
409
-
410
-
411
-
412
-
413
-
414
-
415
-
416
-
417
-
418
-
419
-
420
-
421
-
422
-
423
-
424
-
425
-
426
-
427
-
428
-
429
-
430
-
431
-
432
-
433
-
434
-
435
-
436
-
437
-
438
-
439
-
440
-
441
-
442
-
443
-
444
-
445
-
446
-
447
-
448
-
449
-
450
-
451
-
452
-
453
-
454
-
455
-
456
-
457
-
458
-
459
-
460
-
461
-
462
-
463
-
464
-
465
-
466
-
467
-
468
-
469
-
470
-
471
-
472
-
473
-
474
-
475
-
476
-
477
-
478
-
479
-
480
-
481
-
482
-
483
-
484
-
485
-
486
-
487
-
488
-
489
-
490
-
491
-
492
-
493
-
494
-
495
-
496
-
497
-
498
-
499
-
500
-
501
-
502
-
503
-
504
-
505
-
506
-
507
-
508
-
509
-
510
-
511
-
512
-
513
-
514
-
515
-
516
-
517
-
518
-
519
-
520
-
521
-
522
-
523
-
524
-
525
-
526
-
527
-
528
-
529
-
530
-
531
-
532
-
533
-
534
-
535
-
536
-
537
-
538
-
539
-
540
-
541
-
542
-
543
-
544
-
545
-
546
-
547
-
548
-
549
-
550
-
551
-
552
-
553
-
554
-
555
-
556
-
557
-
558
-
559
-
560
-
561
-
562
-
563
-
564
-
565
-
566
-
567
-
568
-
569
-
570
-
571
-
572
-
573
-
574
-
575
-
576
-
577
-
578
-
579
-
580
-
581
-
582
-
583
-
584
-
585
-
586
-
587
-
588
-
589
-
590
-
591
-
592
-
593
-
594
-
595
-
596
-
597
-
598
-
599
-
600
-
601
-
602
-
603
-
604
-
605
-
606
-
607
-
608
-
609
-
610
-
611
-
612
-
613
-
614
-
615
-
616
-
617
-
618
-
619
-
620
-
621
-
622
-
623
-
624
-
625
-
626
-
627
-
628
-
629
-
630
-
631
-
632
-
633
-
634
-
635
-
636
-
637
-
638
-
639
-
640
-
641
-
642
-
643
-
644
-
645
-
646
-
647
-
648
-
649
-
650
-
651
-
652
-
653
-
654
-
655
-
656
-
657
-
658
-
659
-
660
-
661
-
662
-
663
 |
 |

Table of Contents
• New York represents operations within ISO-NY, which covers the state of New York in its entirety.
• ERCOT represents operations within Electric Reliability Council of Texas, covering most of the state of Texas.
• Other Power Regions:
• South represents operations in the FRCC, MISO’s Southern Region, and the remaining portions of the SERC not included within
MISO or PJM, which includes all or most of Florida, Arkansas, Louisiana, Mississippi, Alabama, Georgia, Tennessee, North
Carolina, South Carolina and parts of Missouri, Kentucky and Texas. Generation’s South region also includes operations in the
SPP, covering Kansas, Oklahoma, most of Nebraska and parts of New Mexico, Texas, Louisiana, Missouri, Mississippi and
Arkansas.
• West represents operations in the WECC, which includes California ISO, and covers the states of California, Oregon, Washington,
Arizona, Nevada, Utah, Idaho, Colorado, and parts of New Mexico, Wyoming and South Dakota.
• Canada represents operations across the entire country of Canada and includes the AESO, OIESO and the Canadian portion of
MISO.
The following business activities are not allocated to a region, and are reported under Other: natural gas, as well as other miscellaneous
business activities that are not significant to Generation’s overall operating revenues or results of operations. Further, the following activities are
not allocated to a region, and are reported in the table below in Other: unrealized mark-to-market impact of economic hedging activities;
amortization of certain intangible assets relating to commodity contracts recorded at fair value from mergers and acquisitions; and other
miscellaneous revenues.
Generation evaluates the operating performance of its power marketing activities using the measure of revenue net of purchased power and
fuel expense, which is a non-GAAP measurement. Generation’s operating revenues include all sales to third parties and affiliated sales to ComEd,
PECO and BGE. Purchased power costs include all costs associated with the procurement and supply of electricity including capacity, energy and
ancillary services. Fuel expense includes the fuel costs for owned generation and fuel costs associated with tolling agreements.
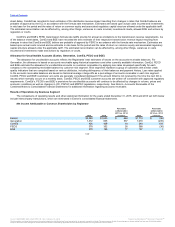
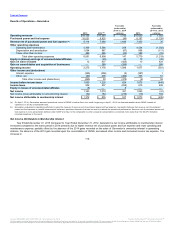
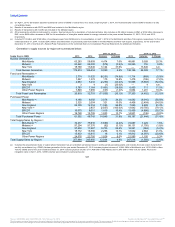
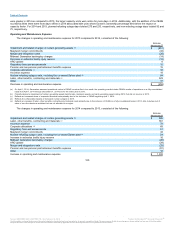
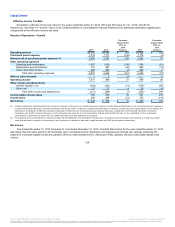
For the years ended December 31, 2015 compared to 2014 and December 31, 2014 compared to 2013, Generation’s revenue net of
purchased power and fuel expense by region were as follows:
2015 vs. 2014 2014 vs. 2013
2015 2014 Variance % Change 2013 Variance % Change
Mid-Atlantic $3,571 $3,431 $ 140 4.1% $3,270 $ 161 4.9%
Midwest 2,892 2,599 293 11.3% 2,586 13 0.5%
New England 461 351 110 31.3% 185 166 89.7%
New York 634 483 151 31.3% (4) 487 n.m.
ERCOT 293 317 (24) (7.6)% 436 (119) (27.3)%
Other Power Regions 250 327 (77) (23.5)% 201 126 62.7%
Total electric revenue net of purchased power and fuel
expense 8,101 7,508 593 7.9% 6,674 834 12.5%
Proprietary Trading 1 42 (41) (97.6)% (8) 50 n.m.
Mark-to-market gains (losses) 257 (591) 848 n.m. 504 (1,095) n.m.
Other 755 509 246 48.3% 263 246 93.5%
Total revenue net of purchased power and fuel expense $9,114 $7,468 $ 1,646 22.0% $7,433 $ 35 0.5%
120
(a)(b)(e)
(c)
(a)(e)
(d)
Source: BALTIMORE GAS & ELECTRIC CO, 10-K, February 10, 2016 Powered by Morningstar® Document Research℠
The information contained herein may not be copied, adapted or distributed and is not warranted to be accurate, complete or timely. The user assumes all risks for any damages or losses arising from any use of this information,
except to the extent such damages or losses cannot be limited or excluded by applicable law. Past financial performance is no guarantee of future results.