ComEd 2015 Annual Report Download - page 117
Download and view the complete annual report
Please find page 117 of the 2015 ComEd annual report below. You can navigate through the pages in the report by either clicking on the pages listed below, or by using the keyword search tool below to find specific information within the annual report.-
 1
1 -
2
-
3
-
4
-
5
-
6
-
7
-
8
-
9
-
10
-
11
-
12
-
13
-
14
-
15
-
16
-
17
-
18
-
19
-
20
-
21
-
22
-
23
-
24
-
25
-
26
-
27
-
28
-
29
-
30
-
31
-
32
-
33
-
34
-
35
-
36
-
37
-
38
-
39
-
40
-
41
-
42
-
43
-
44
-
45
-
46
-
47
-
48
-
49
-
50
-
51
-
52
-
53
-
54
-
55
-
56
-
57
-
58
-
59
-
60
-
61
-
62
-
63
-
64
-
65
-
66
-
67
-
68
-
69
-
70
-
71
-
72
-
73
-
74
-
75
-
76
-
77
-
78
-
79
-
80
-
81
-
82
-
83
-
84
-
85
-
86
-
87
-
88
-
89
-
90
-
91
-
92
-
93
-
94
-
95
-
96
-
97
-
98
-
99
-
100
-
101
-
102
-
103
-
104
-
105
-
106
-
 107
107 -
 108
108 -
 109
109 -
 110
110 -
 111
111 -
 112
112 -
 113
113 -
 114
114 -
 115
115 -
 116
116 -
 117
117 -
 118
118 -
 119
119 -
 120
120 -
 121
121 -
 122
122 -
 123
123 -
 124
124 -
 125
125 -
 126
126 -
 127
127 -
128
-
129
-
130
-
131
-
132
-
133
-
134
-
135
-
136
-
137
-
138
-
139
-
140
-
141
-
142
-
143
-
144
-
145
-
146
-
147
-
148
-
149
-
150
-
151
-
152
-
153
-
154
-
155
-
156
-
157
-
158
-
159
-
160
-
161
-
162
-
163
-
164
-
165
-
166
-
167
-
168
-
169
-
170
-
171
-
172
-
173
-
174
-
175
-
176
-
177
-
178
-
179
-
180
-
181
-
182
-
183
-
184
-
185
-
186
-
187
-
188
-
189
-
190
-
191
-
192
-
193
-
194
-
195
-
196
-
197
-
198
-
199
-
200
-
201
-
202
-
203
-
204
-
205
-
206
-
207
-
208
-
209
-
210
-
211
-
212
-
213
-
214
-
215
-
216
-
217
-
218
-
219
-
220
-
221
-
222
-
223
-
224
-
225
-
226
-
227
-
228
-
229
-
230
-
231
-
232
-
233
-
234
-
235
-
236
-
237
-
238
-
239
-
240
-
241
-
242
-
243
-
244
-
245
-
246
-
247
-
248
-
249
-
250
-
251
-
252
-
253
-
254
-
255
-
256
-
257
-
258
-
259
-
260
-
261
-
262
-
263
-
264
-
265
-
266
-
267
-
268
-
269
-
270
-
271
-
272
-
273
-
274
-
275
-
276
-
277
-
278
-
279
-
280
-
281
-
282
-
283
-
284
-
285
-
286
-
287
-
288
-
289
-
290
-
291
-
292
-
293
-
294
-
295
-
296
-
297
-
298
-
299
-
300
-
301
-
302
-
303
-
304
-
305
-
306
-
307
-
308
-
309
-
310
-
311
-
312
-
313
-
314
-
315
-
316
-
317
-
318
-
319
-
320
-
321
-
322
-
323
-
324
-
325
-
326
-
327
-
328
-
329
-
330
-
331
-
332
-
333
-
334
-
335
-
336
-
337
-
338
-
339
-
340
-
341
-
342
-
343
-
344
-
345
-
346
-
347
-
348
-
349
-
350
-
351
-
352
-
353
-
354
-
355
-
356
-
357
-
358
-
359
-
360
-
361
-
362
-
363
-
364
-
365
-
366
-
367
-
368
-
369
-
370
-
371
-
372
-
373
-
374
-
375
-
376
-
377
-
378
-
379
-
380
-
381
-
382
-
383
-
384
-
385
-
386
-
387
-
388
-
389
-
390
-
391
-
392
-
393
-
394
-
395
-
396
-
397
-
398
-
399
-
400
-
401
-
402
-
403
-
404
-
405
-
406
-
407
-
408
-
409
-
410
-
411
-
412
-
413
-
414
-
415
-
416
-
417
-
418
-
419
-
420
-
421
-
422
-
423
-
424
-
425
-
426
-
427
-
428
-
429
-
430
-
431
-
432
-
433
-
434
-
435
-
436
-
437
-
438
-
439
-
440
-
441
-
442
-
443
-
444
-
445
-
446
-
447
-
448
-
449
-
450
-
451
-
452
-
453
-
454
-
455
-
456
-
457
-
458
-
459
-
460
-
461
-
462
-
463
-
464
-
465
-
466
-
467
-
468
-
469
-
470
-
471
-
472
-
473
-
474
-
475
-
476
-
477
-
478
-
479
-
480
-
481
-
482
-
483
-
484
-
485
-
486
-
487
-
488
-
489
-
490
-
491
-
492
-
493
-
494
-
495
-
496
-
497
-
498
-
499
-
500
-
501
-
502
-
503
-
504
-
505
-
506
-
507
-
508
-
509
-
510
-
511
-
512
-
513
-
514
-
515
-
516
-
517
-
518
-
519
-
520
-
521
-
522
-
523
-
524
-
525
-
526
-
527
-
528
-
529
-
530
-
531
-
532
-
533
-
534
-
535
-
536
-
537
-
538
-
539
-
540
-
541
-
542
-
543
-
544
-
545
-
546
-
547
-
548
-
549
-
550
-
551
-
552
-
553
-
554
-
555
-
556
-
557
-
558
-
559
-
560
-
561
-
562
-
563
-
564
-
565
-
566
-
567
-
568
-
569
-
570
-
571
-
572
-
573
-
574
-
575
-
576
-
577
-
578
-
579
-
580
-
581
-
582
-
583
-
584
-
585
-
586
-
587
-
588
-
589
-
590
-
591
-
592
-
593
-
594
-
595
-
596
-
597
-
598
-
599
-
600
-
601
-
602
-
603
-
604
-
605
-
606
-
607
-
608
-
609
-
610
-
611
-
612
-
613
-
614
-
615
-
616
-
617
-
618
-
619
-
620
-
621
-
622
-
623
-
624
-
625
-
626
-
627
-
628
-
629
-
630
-
631
-
632
-
633
-
634
-
635
-
636
-
637
-
638
-
639
-
640
-
641
-
642
-
643
-
644
-
645
-
646
-
647
-
648
-
649
-
650
-
651
-
652
-
653
-
654
-
655
-
656
-
657
-
658
-
659
-
660
-
661
-
662
-
663
 |
 |

Table of Contents
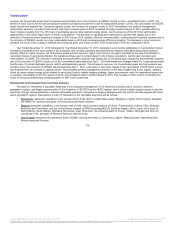
have a cap on cost growth. Accounting guidance requires that annual health care cost estimates be developed using past and present health care
cost trends (both for Exelon and across the broader economy), as well as expectations of health care cost escalation, changes in health care
utilization and delivery patterns, technological advances and changes in the health status of plan participants. Therefore, the trend rate assumption
is subject to significant uncertainty. Exelon assumed an initial health care cost trend rate of 6.00% for 2015, decreasing to an ultimate health care
cost trend rate of 5.00% in 2017.
Mortality. The mortality assumption is composed of a base table that represents the current expectation of life expectancy of the population
adjusted by an improvement scale that attempts to anticipate future improvements in life expectancy. Exelon uses a mortality base table for its
accounting valuation that is consistent with the IRS required table for funding (referred to as RP-2000). Exelon has a substantial employee
population that provides a credible basis for mortality evaluation. Exelon is utilizing the Scale BB 2-Dimensional improvement scale with long-term
improvements of 0.75% for its mortality improvement assumption.
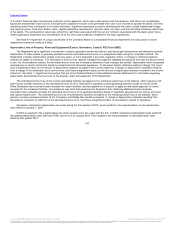
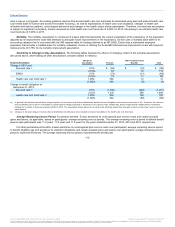
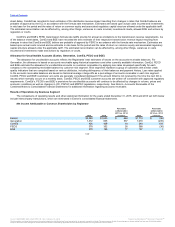
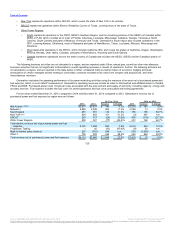
Sensitivity to Changes in Key Assumptions. The following tables illustrate the effects of changing certain of the actuarial assumptions
discussed above, while holding all other assumptions constant (dollars in millions):
Actuarial Assumption
Change in
Assumption Pension
Other Postretirement
Benefits Total
Change in 2015 cost:
Discount rate 0.5% $ (69) $ (19) $ (88)
(0.5)% 83 30 113
EROA 0.5% (73) (11) (84)
(0.5)% 73 11 84
Health care cost trend rate 1.00% N/A 12 12
(1.00)% N/A (9) (9)
Change in benefit obligation at
December 31, 2015:
Discount rate 0.5% (1,042) (249) (1,291)
(0.5)% 1,210 289 1,499
Health care cost trend rate 1.00% N/A 100 100
(1.00)% N/A (89) (89)
(a) In general, the discount rate will have a larger impact on the pension and other postretirement benefit cost and obligation as the rate moves closer to 0%. Therefore, the discount
rate sensitivities above cannot necessarily be extrapolated for larger increases or decreases in the discount rate. Additionally, Exelon implemented a liability-driven investment
strategy for a portion of its pension asset portfolio in 2010. The sensitivities shown above do not reflect the offsetting impact that changes in discount rates may have on pension
asset returns.
(b) Changes in the plan design of certain other postretirement benefit plans have resulted in reduced sensitivity to the health care cost trend rate.
Average Remaining Service Period. For pension benefits, Exelon amortizes its unrecognized prior service costs and certain actuarial
gains and losses, as applicable, based on participants’ average remaining service periods. The average remaining service period of defined benefit
pension plan participants was 11.9 years, 11.8 years and 11.8 years for the years ended December 31, 2015, 2014 and 2013, respectively.
For other postretirement benefits, Exelon amortizes its unrecognized prior service costs over participants’ average remaining service period
to benefit eligibility age and amortizes its transition obligations and certain actuarial gains and losses over participants’ average remaining service
period to expected retirement. The average remaining service period of postretirement benefit plan
110
(a)
(b)
(a)
(b)
Source: BALTIMORE GAS & ELECTRIC CO, 10-K, February 10, 2016 Powered by Morningstar® Document Research℠
The information contained herein may not be copied, adapted or distributed and is not warranted to be accurate, complete or timely. The user assumes all risks for any damages or losses arising from any use of this information,
except to the extent such damages or losses cannot be limited or excluded by applicable law. Past financial performance is no guarantee of future results.