ComEd 2015 Annual Report Download - page 375
Download and view the complete annual report
Please find page 375 of the 2015 ComEd annual report below. You can navigate through the pages in the report by either clicking on the pages listed below, or by using the keyword search tool below to find specific information within the annual report.-
 1
1 -
2
-
3
-
4
-
5
-
6
-
7
-
8
-
9
-
10
-
11
-
12
-
13
-
14
-
15
-
16
-
17
-
18
-
19
-
20
-
21
-
22
-
23
-
24
-
25
-
26
-
27
-
28
-
29
-
30
-
31
-
32
-
33
-
34
-
35
-
36
-
37
-
38
-
39
-
40
-
41
-
42
-
43
-
44
-
45
-
46
-
47
-
48
-
49
-
50
-
51
-
52
-
53
-
54
-
55
-
56
-
57
-
58
-
59
-
60
-
61
-
62
-
63
-
64
-
65
-
66
-
67
-
68
-
69
-
70
-
71
-
72
-
73
-
74
-
75
-
76
-
77
-
78
-
79
-
80
-
81
-
82
-
83
-
84
-
85
-
86
-
87
-
88
-
89
-
90
-
91
-
92
-
93
-
94
-
95
-
96
-
97
-
98
-
99
-
100
-
101
-
102
-
103
-
104
-
105
-
106
-
107
-
108
-
109
-
110
-
111
-
112
-
113
-
114
-
115
-
116
-
117
-
118
-
119
-
120
-
121
-
122
-
123
-
124
-
125
-
126
-
127
-
128
-
129
-
130
-
131
-
132
-
133
-
134
-
135
-
136
-
137
-
138
-
139
-
140
-
141
-
142
-
143
-
144
-
145
-
146
-
147
-
148
-
149
-
150
-
151
-
152
-
153
-
154
-
155
-
156
-
157
-
158
-
159
-
160
-
161
-
162
-
163
-
164
-
165
-
166
-
167
-
168
-
169
-
170
-
171
-
172
-
173
-
174
-
175
-
176
-
177
-
178
-
179
-
180
-
181
-
182
-
183
-
184
-
185
-
186
-
187
-
188
-
189
-
190
-
191
-
192
-
193
-
194
-
195
-
196
-
197
-
198
-
199
-
200
-
201
-
202
-
203
-
204
-
205
-
206
-
207
-
208
-
209
-
210
-
211
-
212
-
213
-
214
-
215
-
216
-
217
-
218
-
219
-
220
-
221
-
222
-
223
-
224
-
225
-
226
-
227
-
228
-
229
-
230
-
231
-
232
-
233
-
234
-
235
-
236
-
237
-
238
-
239
-
240
-
241
-
242
-
243
-
244
-
245
-
246
-
247
-
248
-
249
-
250
-
251
-
252
-
253
-
254
-
255
-
256
-
257
-
258
-
259
-
260
-
261
-
262
-
263
-
264
-
265
-
266
-
267
-
268
-
269
-
270
-
271
-
272
-
273
-
274
-
275
-
276
-
277
-
278
-
279
-
280
-
281
-
282
-
283
-
284
-
285
-
286
-
287
-
288
-
289
-
290
-
291
-
292
-
293
-
294
-
295
-
296
-
297
-
298
-
299
-
300
-
301
-
302
-
303
-
304
-
305
-
306
-
307
-
308
-
309
-
310
-
311
-
312
-
313
-
314
-
315
-
316
-
317
-
318
-
319
-
320
-
321
-
322
-
323
-
324
-
325
-
326
-
327
-
328
-
329
-
330
-
331
-
332
-
333
-
334
-
335
-
336
-
337
-
338
-
339
-
340
-
341
-
342
-
343
-
344
-
345
-
346
-
347
-
348
-
349
-
350
-
351
-
352
-
353
-
354
-
355
-
356
-
357
-
358
-
359
-
360
-
361
-
362
-
363
-
364
-
 365
365 -
 366
366 -
 367
367 -
 368
368 -
 369
369 -
 370
370 -
 371
371 -
 372
372 -
 373
373 -
 374
374 -
 375
375 -
 376
376 -
 377
377 -
 378
378 -
 379
379 -
 380
380 -
 381
381 -
 382
382 -
 383
383 -
 384
384 -
 385
385 -
386
-
387
-
388
-
389
-
390
-
391
-
392
-
393
-
394
-
395
-
396
-
397
-
398
-
399
-
400
-
401
-
402
-
403
-
404
-
405
-
406
-
407
-
408
-
409
-
410
-
411
-
412
-
413
-
414
-
415
-
416
-
417
-
418
-
419
-
420
-
421
-
422
-
423
-
424
-
425
-
426
-
427
-
428
-
429
-
430
-
431
-
432
-
433
-
434
-
435
-
436
-
437
-
438
-
439
-
440
-
441
-
442
-
443
-
444
-
445
-
446
-
447
-
448
-
449
-
450
-
451
-
452
-
453
-
454
-
455
-
456
-
457
-
458
-
459
-
460
-
461
-
462
-
463
-
464
-
465
-
466
-
467
-
468
-
469
-
470
-
471
-
472
-
473
-
474
-
475
-
476
-
477
-
478
-
479
-
480
-
481
-
482
-
483
-
484
-
485
-
486
-
487
-
488
-
489
-
490
-
491
-
492
-
493
-
494
-
495
-
496
-
497
-
498
-
499
-
500
-
501
-
502
-
503
-
504
-
505
-
506
-
507
-
508
-
509
-
510
-
511
-
512
-
513
-
514
-
515
-
516
-
517
-
518
-
519
-
520
-
521
-
522
-
523
-
524
-
525
-
526
-
527
-
528
-
529
-
530
-
531
-
532
-
533
-
534
-
535
-
536
-
537
-
538
-
539
-
540
-
541
-
542
-
543
-
544
-
545
-
546
-
547
-
548
-
549
-
550
-
551
-
552
-
553
-
554
-
555
-
556
-
557
-
558
-
559
-
560
-
561
-
562
-
563
-
564
-
565
-
566
-
567
-
568
-
569
-
570
-
571
-
572
-
573
-
574
-
575
-
576
-
577
-
578
-
579
-
580
-
581
-
582
-
583
-
584
-
585
-
586
-
587
-
588
-
589
-
590
-
591
-
592
-
593
-
594
-
595
-
596
-
597
-
598
-
599
-
600
-
601
-
602
-
603
-
604
-
605
-
606
-
607
-
608
-
609
-
610
-
611
-
612
-
613
-
614
-
615
-
616
-
617
-
618
-
619
-
620
-
621
-
622
-
623
-
624
-
625
-
626
-
627
-
628
-
629
-
630
-
631
-
632
-
633
-
634
-
635
-
636
-
637
-
638
-
639
-
640
-
641
-
642
-
643
-
644
-
645
-
646
-
647
-
648
-
649
-
650
-
651
-
652
-
653
-
654
-
655
-
656
-
657
-
658
-
659
-
660
-
661
-
662
-
663
 |
 |
Table of Contents
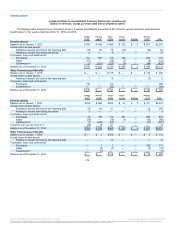
Combined Notes to Consolidated Financial Statements—(Continued)
(Dollars in millions, except per share data unless otherwise noted)
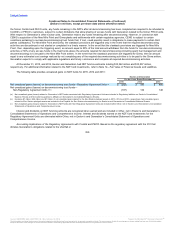
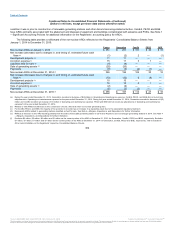
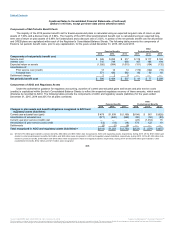
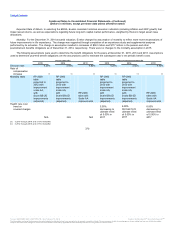
Components of Net Periodic Benefit Costs
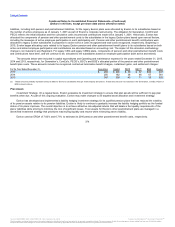
The majority of the 2015 pension benefit cost for Exelon-sponsored plans is calculated using an expected long-term rate of return on plan
assets of 7.00% and a discount rate of 3.94%. The majority of the 2015 other postretirement benefit cost is calculated using an expected long-
term rate of return on plan assets of 6.46% for funded plans and a discount rate of 3.92%. A portion of the net periodic benefit cost for all pension
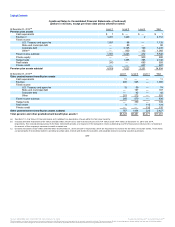
and OPEB plans are capitalized within each of the Registrant’s Consolidated Balance Sheets. The following table presents the components of
Exelon’s net periodic benefit costs, prior to any capitalization, for the years ended December 31, 2015, 2014 and 2013.
Pension Benefits
Other
Postretirement Benefits
2015 2014 2013 2015 2014 2013
Components of net periodic benefit cost:
Service cost $ 326 $ 293 $ 317 $ 119 $ 117 $ 162
Interest cost 710 749 650 167 186 194
Expected return on assets (1,026) (994) (1,015) (151) (154) (132)
Amortization of:
Prior service cost (credit) 13 14 14 (174) (122) (19)
Actuarial loss 571 420 562 80 50 83
Settlement charges 2 2 9 — — —
Net periodic benefit cost $ 596 $ 484 $ 537 $ 41 $ 77 $ 288
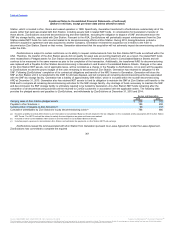
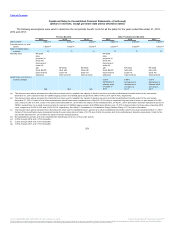
Components of AOCI and Regulatory Assets
Under the authoritative guidance for regulatory accounting, a portion of current year actuarial gains and losses and prior service costs
(credits) is capitalized within Exelon’s Consolidated Balance Sheets to reflect the expected regulatory recovery of these amounts, which would
otherwise be recorded to AOCI. The following tables provide the components of AOCI and regulatory assets (liabilities) for the years ended
December 31, 2015, 2014 and 2013 for all plans combined.
Pension Benefits
Other
Postretirement Benefits
2015 2014 2013 2015 2014 2013
Changes in plan assets and benefit obligations recognized in AOCI and
regulatory assets (liabilities):
Current year actuarial loss (gain) $ 476 $1,639 $ (1,169) $(194) $ 561 $ (628)
Amortization of actuarial loss (571) (420) (562) (80) (50) (83)
Current year prior service (credit) cost — — — (23) (1,012) 15
Amortization of prior service (cost) credit (13) (14) (14) 174 122 19
Settlements (2) (2) (8) — — —
Total recognized in AOCI and regulatory assets (liabilities) $(110) $1,203 $ (1,753) $(123) $ (379) $ (677)
(a) Of the $110 million gain related to pension benefits, $64 million and $46 million were recognized in AOCI and regulatory assets, respectively, during 2015. Of the $123 million gain
related to other postretirement benefits, $63 million and $60 million were recognized in AOCI and regulatory assets (liabilities), respectively, during 2015. Of the $1,203 million loss
related to pension benefits, $788 million and $415 million were recognized in AOCI and regulatory assets, respectively, during 2014. Of the $379 million gain related to other
postretirement benefits, $162 million and $217 million were recognized
368
(a)
Source: BALTIMORE GAS & ELECTRIC CO, 10-K, February 10, 2016 Powered by Morningstar® Document Research℠
The information contained herein may not be copied, adapted or distributed and is not warranted to be accurate, complete or timely. The user assumes all risks for any damages or losses arising from any use of this information,
except to the extent such damages or losses cannot be limited or excluded by applicable law. Past financial performance is no guarantee of future results.