ComEd 2015 Annual Report Download - page 318
Download and view the complete annual report
Please find page 318 of the 2015 ComEd annual report below. You can navigate through the pages in the report by either clicking on the pages listed below, or by using the keyword search tool below to find specific information within the annual report.-
 1
1 -
2
-
3
-
4
-
5
-
6
-
7
-
8
-
9
-
10
-
11
-
12
-
13
-
14
-
15
-
16
-
17
-
18
-
19
-
20
-
21
-
22
-
23
-
24
-
25
-
26
-
27
-
28
-
29
-
30
-
31
-
32
-
33
-
34
-
35
-
36
-
37
-
38
-
39
-
40
-
41
-
42
-
43
-
44
-
45
-
46
-
47
-
48
-
49
-
50
-
51
-
52
-
53
-
54
-
55
-
56
-
57
-
58
-
59
-
60
-
61
-
62
-
63
-
64
-
65
-
66
-
67
-
68
-
69
-
70
-
71
-
72
-
73
-
74
-
75
-
76
-
77
-
78
-
79
-
80
-
81
-
82
-
83
-
84
-
85
-
86
-
87
-
88
-
89
-
90
-
91
-
92
-
93
-
94
-
95
-
96
-
97
-
98
-
99
-
100
-
101
-
102
-
103
-
104
-
105
-
106
-
107
-
108
-
109
-
110
-
111
-
112
-
113
-
114
-
115
-
116
-
117
-
118
-
119
-
120
-
121
-
122
-
123
-
124
-
125
-
126
-
127
-
128
-
129
-
130
-
131
-
132
-
133
-
134
-
135
-
136
-
137
-
138
-
139
-
140
-
141
-
142
-
143
-
144
-
145
-
146
-
147
-
148
-
149
-
150
-
151
-
152
-
153
-
154
-
155
-
156
-
157
-
158
-
159
-
160
-
161
-
162
-
163
-
164
-
165
-
166
-
167
-
168
-
169
-
170
-
171
-
172
-
173
-
174
-
175
-
176
-
177
-
178
-
179
-
180
-
181
-
182
-
183
-
184
-
185
-
186
-
187
-
188
-
189
-
190
-
191
-
192
-
193
-
194
-
195
-
196
-
197
-
198
-
199
-
200
-
201
-
202
-
203
-
204
-
205
-
206
-
207
-
208
-
209
-
210
-
211
-
212
-
213
-
214
-
215
-
216
-
217
-
218
-
219
-
220
-
221
-
222
-
223
-
224
-
225
-
226
-
227
-
228
-
229
-
230
-
231
-
232
-
233
-
234
-
235
-
236
-
237
-
238
-
239
-
240
-
241
-
242
-
243
-
244
-
245
-
246
-
247
-
248
-
249
-
250
-
251
-
252
-
253
-
254
-
255
-
256
-
257
-
258
-
259
-
260
-
261
-
262
-
263
-
264
-
265
-
266
-
267
-
268
-
269
-
270
-
271
-
272
-
273
-
274
-
275
-
276
-
277
-
278
-
279
-
280
-
281
-
282
-
283
-
284
-
285
-
286
-
287
-
288
-
289
-
290
-
291
-
292
-
293
-
294
-
295
-
296
-
297
-
298
-
299
-
300
-
301
-
302
-
303
-
304
-
305
-
306
-
307
-
 308
308 -
 309
309 -
 310
310 -
 311
311 -
 312
312 -
 313
313 -
 314
314 -
 315
315 -
 316
316 -
 317
317 -
 318
318 -
 319
319 -
 320
320 -
 321
321 -
 322
322 -
 323
323 -
 324
324 -
 325
325 -
 326
326 -
 327
327 -
 328
328 -
329
-
330
-
331
-
332
-
333
-
334
-
335
-
336
-
337
-
338
-
339
-
340
-
341
-
342
-
343
-
344
-
345
-
346
-
347
-
348
-
349
-
350
-
351
-
352
-
353
-
354
-
355
-
356
-
357
-
358
-
359
-
360
-
361
-
362
-
363
-
364
-
365
-
366
-
367
-
368
-
369
-
370
-
371
-
372
-
373
-
374
-
375
-
376
-
377
-
378
-
379
-
380
-
381
-
382
-
383
-
384
-
385
-
386
-
387
-
388
-
389
-
390
-
391
-
392
-
393
-
394
-
395
-
396
-
397
-
398
-
399
-
400
-
401
-
402
-
403
-
404
-
405
-
406
-
407
-
408
-
409
-
410
-
411
-
412
-
413
-
414
-
415
-
416
-
417
-
418
-
419
-
420
-
421
-
422
-
423
-
424
-
425
-
426
-
427
-
428
-
429
-
430
-
431
-
432
-
433
-
434
-
435
-
436
-
437
-
438
-
439
-
440
-
441
-
442
-
443
-
444
-
445
-
446
-
447
-
448
-
449
-
450
-
451
-
452
-
453
-
454
-
455
-
456
-
457
-
458
-
459
-
460
-
461
-
462
-
463
-
464
-
465
-
466
-
467
-
468
-
469
-
470
-
471
-
472
-
473
-
474
-
475
-
476
-
477
-
478
-
479
-
480
-
481
-
482
-
483
-
484
-
485
-
486
-
487
-
488
-
489
-
490
-
491
-
492
-
493
-
494
-
495
-
496
-
497
-
498
-
499
-
500
-
501
-
502
-
503
-
504
-
505
-
506
-
507
-
508
-
509
-
510
-
511
-
512
-
513
-
514
-
515
-
516
-
517
-
518
-
519
-
520
-
521
-
522
-
523
-
524
-
525
-
526
-
527
-
528
-
529
-
530
-
531
-
532
-
533
-
534
-
535
-
536
-
537
-
538
-
539
-
540
-
541
-
542
-
543
-
544
-
545
-
546
-
547
-
548
-
549
-
550
-
551
-
552
-
553
-
554
-
555
-
556
-
557
-
558
-
559
-
560
-
561
-
562
-
563
-
564
-
565
-
566
-
567
-
568
-
569
-
570
-
571
-
572
-
573
-
574
-
575
-
576
-
577
-
578
-
579
-
580
-
581
-
582
-
583
-
584
-
585
-
586
-
587
-
588
-
589
-
590
-
591
-
592
-
593
-
594
-
595
-
596
-
597
-
598
-
599
-
600
-
601
-
602
-
603
-
604
-
605
-
606
-
607
-
608
-
609
-
610
-
611
-
612
-
613
-
614
-
615
-
616
-
617
-
618
-
619
-
620
-
621
-
622
-
623
-
624
-
625
-
626
-
627
-
628
-
629
-
630
-
631
-
632
-
633
-
634
-
635
-
636
-
637
-
638
-
639
-
640
-
641
-
642
-
643
-
644
-
645
-
646
-
647
-
648
-
649
-
650
-
651
-
652
-
653
-
654
-
655
-
656
-
657
-
658
-
659
-
660
-
661
-
662
-
663
 |
 |

Table of Contents
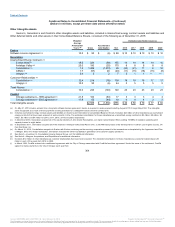
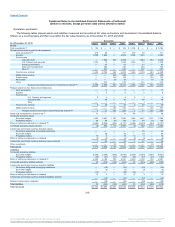
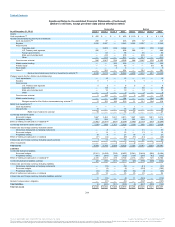
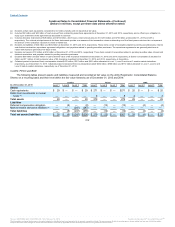
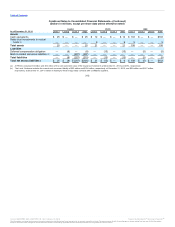
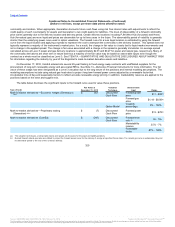
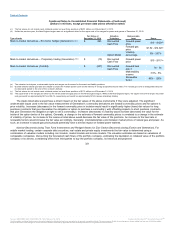
Combined Notes to Consolidated Financial Statements—(Continued)
(Dollars in millions, except per share data unless otherwise noted)
Generation Exelon
As of December 31, 2014 Level 1 Level 2 Level 3 Total Level 1 Level 2 Level 3 Total
Assets
Cash equivalents $ 405 $ — $ — $ 405 $ 1,119 $ — $ — $ 1,119
Nuclear decommissioning trust fund investments
Cash equivalents 208 37 — 245 208 37 — 245
Equities 3,035 2,207 — 5,242 3,035 2,207 — 5,242
Fixed income
Corporate debt — 2,023 239 2,262 — 2,023 239 2,262
U.S. Treasury and agencies 996 — — 996 996 — — 996
Foreign governments — 95 — 95 — 95 — 95
State and municipal debt — 438 — 438 — 438 — 438
Other — 511 — 511 — 511 — 511
Fixed income subtotal 996 3,067 239 4,302 996 3,067 239 4,302
Middle market lending — — 366 366 — — 366 366
Private equity — — 83 83 — — 83 83
Real estate — — 3 3 — — 3 3
Other — 301 — 301 — 301 — 301
Nuclear decommissioning trust fund investments subtotal 4,239 5,612 691 10,542 4,239 5,612 691 10,542
Pledged assets for Zion Station decommissioning
Cash equivalents — 15 — 15 — 15 — 15
Equities 6 1 — 7 6 1 — 7
Fixed income
U.S. Treasury and agencies 5 3 — 8 5 3 — 8
Corporate debt — 89 — 89 — 89 — 89
State and municipal debt — 10 — 10 — 10 — 10
Other — 3 — 3 — 3 — 3
Fixed income subtotal 5 105 — 110 5 105 — 110
Middle market lending — — 184 184 — — 184 184
Pledged assets for Zion Station decommissioning subtotal 11 121 184 316 11 121 184 316
Rabbi trust investments
Cash equivalents — — — — 1 — — 1
Mutual funds 16 — — 16 46 — — 46
Rabbi trust investments subtotal 16 — — 16 47 — — 47
Commodity derivative assets — —
Economic hedges 1,667 3,465 1,681 6,813 1,667 3,465 1,681 6,813
Proprietary trading 201 284 27 512 201 284 27 512
Effect of netting and allocation of collateral (1,982) (2,757) (557) (5,296) (1,982) (2,757) (557) (5,296)
Commodity derivative assets subtotal (114) 992 1,151 2,029 (114) 992 1,151 2,029
Interest rate and foreign currency derivative assets — —
Derivatives designated as hedging instruments — 8 — 8 — 31 — 31
Economic hedges — 12 — 12 — 13 — 13
Proprietary trading 18 9 — 27 18 9 — 27
Effect of netting and allocation of collateral (17) (12) — (29) (17) (31) — (48)
Interest rate and foreign currency derivative assets subtotal 1 17 — 18 1 22 — 23
Other investments — — 3 3 2 — 3 5
Total assets 4,558 6,742 2,029 13,329 5,305 6,747 2,029 14,081
Liabilities
Commodity derivative liabilities
Economic hedges (2,241) (3,458) (788) (6,487) (2,241) (3,458) (995) (6,694)
Proprietary trading (195) (295) (42) (532) (195) (295) (42) (532)
Effect of netting and allocation of collateral 2,416 3,557 729 6,702 2,416 3,557 729 6,702
Commodity derivative liabilities subtotal (20) (196) (101) (317) (20) (196) (308) (524)
Interest rate and foreign currency derivative liabilities — —
Derivatives designated as hedging instruments — (12) — (12) — (41) — (41)
Economic hedges — (2) — (2) — (103) — (103)
Proprietary trading (14) (9) — (23) (14) (9) — (23)
Effect of netting and allocation of collateral 25 10 — 35 25 29 — 54
Interest rate and foreign currency derivative liabilities subtotal
11 (13) — (2) 11 (124) — (113)
Deferred compensation obligation — (31) — (31) — (107) — (107)
Total liabilities (9) (240) (101) (350) (9) (427) (308) (744)
Total net assets $ 4,549 $ 6,502 $ 1,928 $12,979 $ 5,296 $ 6,320 $ 1,721 $13,337
311
(a)
(b)
(c)
(d)
(e)
(f)
(g)
(g)
Source: BALTIMORE GAS & ELECTRIC CO, 10-K, February 10, 2016 Powered by Morningstar® Document Research℠
The information contained herein may not be copied, adapted or distributed and is not warranted to be accurate, complete or timely. The user assumes all risks for any damages or losses arising from any use of this information,
except to the extent such damages or losses cannot be limited or excluded by applicable law. Past financial performance is no guarantee of future results.