ComEd 2015 Annual Report Download - page 128
Download and view the complete annual report
Please find page 128 of the 2015 ComEd annual report below. You can navigate through the pages in the report by either clicking on the pages listed below, or by using the keyword search tool below to find specific information within the annual report.-
 1
1 -
2
-
3
-
4
-
5
-
6
-
7
-
8
-
9
-
10
-
11
-
12
-
13
-
14
-
15
-
16
-
17
-
18
-
19
-
20
-
21
-
22
-
23
-
24
-
25
-
26
-
27
-
28
-
29
-
30
-
31
-
32
-
33
-
34
-
35
-
36
-
37
-
38
-
39
-
40
-
41
-
42
-
43
-
44
-
45
-
46
-
47
-
48
-
49
-
50
-
51
-
52
-
53
-
54
-
55
-
56
-
57
-
58
-
59
-
60
-
61
-
62
-
63
-
64
-
65
-
66
-
67
-
68
-
69
-
70
-
71
-
72
-
73
-
74
-
75
-
76
-
77
-
78
-
79
-
80
-
81
-
82
-
83
-
84
-
85
-
86
-
87
-
88
-
89
-
90
-
91
-
92
-
93
-
94
-
95
-
96
-
97
-
98
-
99
-
100
-
101
-
102
-
103
-
104
-
105
-
106
-
107
-
108
-
109
-
110
-
111
-
112
-
113
-
114
-
115
-
116
-
117
-
 118
118 -
 119
119 -
 120
120 -
 121
121 -
 122
122 -
 123
123 -
 124
124 -
 125
125 -
 126
126 -
 127
127 -
 128
128 -
 129
129 -
 130
130 -
 131
131 -
 132
132 -
 133
133 -
 134
134 -
 135
135 -
 136
136 -
 137
137 -
 138
138 -
139
-
140
-
141
-
142
-
143
-
144
-
145
-
146
-
147
-
148
-
149
-
150
-
151
-
152
-
153
-
154
-
155
-
156
-
157
-
158
-
159
-
160
-
161
-
162
-
163
-
164
-
165
-
166
-
167
-
168
-
169
-
170
-
171
-
172
-
173
-
174
-
175
-
176
-
177
-
178
-
179
-
180
-
181
-
182
-
183
-
184
-
185
-
186
-
187
-
188
-
189
-
190
-
191
-
192
-
193
-
194
-
195
-
196
-
197
-
198
-
199
-
200
-
201
-
202
-
203
-
204
-
205
-
206
-
207
-
208
-
209
-
210
-
211
-
212
-
213
-
214
-
215
-
216
-
217
-
218
-
219
-
220
-
221
-
222
-
223
-
224
-
225
-
226
-
227
-
228
-
229
-
230
-
231
-
232
-
233
-
234
-
235
-
236
-
237
-
238
-
239
-
240
-
241
-
242
-
243
-
244
-
245
-
246
-
247
-
248
-
249
-
250
-
251
-
252
-
253
-
254
-
255
-
256
-
257
-
258
-
259
-
260
-
261
-
262
-
263
-
264
-
265
-
266
-
267
-
268
-
269
-
270
-
271
-
272
-
273
-
274
-
275
-
276
-
277
-
278
-
279
-
280
-
281
-
282
-
283
-
284
-
285
-
286
-
287
-
288
-
289
-
290
-
291
-
292
-
293
-
294
-
295
-
296
-
297
-
298
-
299
-
300
-
301
-
302
-
303
-
304
-
305
-
306
-
307
-
308
-
309
-
310
-
311
-
312
-
313
-
314
-
315
-
316
-
317
-
318
-
319
-
320
-
321
-
322
-
323
-
324
-
325
-
326
-
327
-
328
-
329
-
330
-
331
-
332
-
333
-
334
-
335
-
336
-
337
-
338
-
339
-
340
-
341
-
342
-
343
-
344
-
345
-
346
-
347
-
348
-
349
-
350
-
351
-
352
-
353
-
354
-
355
-
356
-
357
-
358
-
359
-
360
-
361
-
362
-
363
-
364
-
365
-
366
-
367
-
368
-
369
-
370
-
371
-
372
-
373
-
374
-
375
-
376
-
377
-
378
-
379
-
380
-
381
-
382
-
383
-
384
-
385
-
386
-
387
-
388
-
389
-
390
-
391
-
392
-
393
-
394
-
395
-
396
-
397
-
398
-
399
-
400
-
401
-
402
-
403
-
404
-
405
-
406
-
407
-
408
-
409
-
410
-
411
-
412
-
413
-
414
-
415
-
416
-
417
-
418
-
419
-
420
-
421
-
422
-
423
-
424
-
425
-
426
-
427
-
428
-
429
-
430
-
431
-
432
-
433
-
434
-
435
-
436
-
437
-
438
-
439
-
440
-
441
-
442
-
443
-
444
-
445
-
446
-
447
-
448
-
449
-
450
-
451
-
452
-
453
-
454
-
455
-
456
-
457
-
458
-
459
-
460
-
461
-
462
-
463
-
464
-
465
-
466
-
467
-
468
-
469
-
470
-
471
-
472
-
473
-
474
-
475
-
476
-
477
-
478
-
479
-
480
-
481
-
482
-
483
-
484
-
485
-
486
-
487
-
488
-
489
-
490
-
491
-
492
-
493
-
494
-
495
-
496
-
497
-
498
-
499
-
500
-
501
-
502
-
503
-
504
-
505
-
506
-
507
-
508
-
509
-
510
-
511
-
512
-
513
-
514
-
515
-
516
-
517
-
518
-
519
-
520
-
521
-
522
-
523
-
524
-
525
-
526
-
527
-
528
-
529
-
530
-
531
-
532
-
533
-
534
-
535
-
536
-
537
-
538
-
539
-
540
-
541
-
542
-
543
-
544
-
545
-
546
-
547
-
548
-
549
-
550
-
551
-
552
-
553
-
554
-
555
-
556
-
557
-
558
-
559
-
560
-
561
-
562
-
563
-
564
-
565
-
566
-
567
-
568
-
569
-
570
-
571
-
572
-
573
-
574
-
575
-
576
-
577
-
578
-
579
-
580
-
581
-
582
-
583
-
584
-
585
-
586
-
587
-
588
-
589
-
590
-
591
-
592
-
593
-
594
-
595
-
596
-
597
-
598
-
599
-
600
-
601
-
602
-
603
-
604
-
605
-
606
-
607
-
608
-
609
-
610
-
611
-
612
-
613
-
614
-
615
-
616
-
617
-
618
-
619
-
620
-
621
-
622
-
623
-
624
-
625
-
626
-
627
-
628
-
629
-
630
-
631
-
632
-
633
-
634
-
635
-
636
-
637
-
638
-
639
-
640
-
641
-
642
-
643
-
644
-
645
-
646
-
647
-
648
-
649
-
650
-
651
-
652
-
653
-
654
-
655
-
656
-
657
-
658
-
659
-
660
-
661
-
662
-
663
 |
 |

Table of Contents
(a) On April 1, 2014, Generation assumed operational control of CENG’s nuclear fleet. As a result, beginning April 1, 2014, the financial results include CENG’s results on a fully
consolidated basis.
(b) Results of transactions with PECO and BGE are included in the Mid-Atlantic region.
(c) Results of transactions with ComEd are included in the Midwest region.
(d) Other represents activities not allocated to a region. See text above for a description of included activities. Also includes an $8 million increase to RNF, a $124 million decrease to
RNF, and a $488 million decrease to RNF for the amortization of intangible assets related to energy contracts for the years ended December 31, 2015, 2014, and 2013,
respectively.
(e) Includes $113 million and $169 million of purchased power from CENG prior to its consolidation on April 1, 2014 in the Mid-Atlantic and New York regions, respectively, for the year
ended December 31, 2014. Includes $542 million and $450 million of purchased power from CENG in the Mid-Atlantic and New York regions, respectively, for the year ended
December 31, 2013. See Note 26—Related Party Transactions of the Combined Notes to Consolidated Financial Statements for additional information.
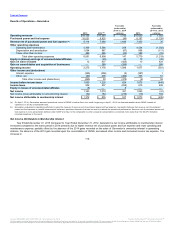
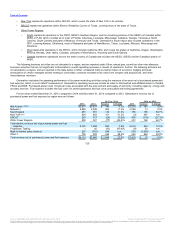
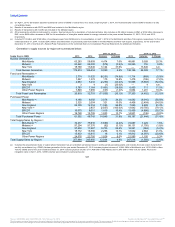
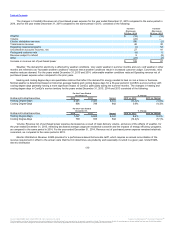
Generation’s supply sources by region are summarized below:
2015 vs. 2014 2014 vs. 2013
Supply Source (GWh) 2015 2014 Variance % Change 2013 Variance % Change
Nuclear Generation
Mid-Atlantic 63,283 58,809 4,474 7.6% 48,881 9,928 20.3%
Midwest 93,422 94,000 (578) (0.6)% 93,245 755 0.8%
New York 18,769 13,645 5,124 37.6% — 13,645 n.m.
Total Nuclear Generation 175,474 166,454 9,020 5.4% 142,126 24,328 17.1%
Fossil and Renewables
Mid-Atlantic 2,774 11,025 (8,251) (74.8)% 11,714 (689) (5.9)%
Midwest 1,547 1,372 175 12.8% 1,478 (106) (7.2)%
New England 2,983 5,233 (2,250) (43.0)% 10,896 (5,663) (52.0)%
New York 3 4 (1) (25.0)% — 4 n.m.
ERCOT 5,763 7,164 (1,401) (19.6)% 6,453 711 11.0%
Other Power Regions 7,848 7,955 (107) (1.3)% 6,664 1,291 19.4%
Total Fossil and Renewables 20,918 32,753 (11,835) (36.1)% 37,205 (4,452) (12.0)%
Purchased Power
Mid-Atlantic 8,160 6,082 2,078 34.2% 14,092 (8,010) (56.8)%
Midwest 2,325 2,004 321 16.0% 4,408 (2,404) (54.5)%
New England 24,309 12,354 11,955 96.8% 7,655 4,699 61.4%
New York — 2,857 (2,857) (100.0)% 13,642 (10,785) (79.1)%
ERCOT 10,070 8,651 1,419 16.4% 13,459 (4,808) (35.7)%
Other Power Regions 16,728 14,795 1,933 13.1% 14,931 (136) (0.9)%
Total Purchased Power 61,592 46,743 14,849 31.8% 68,187 (21,444) (31.4)%
Total Supply/Sales by Region
Mid-Atlantic 74,217 75,916 (1,699) (2.2)% 74,687 1,229 1.6%
Midwest 97,294 97,376 (82) (0.1)% 99,131 (1,755) (1.8)%
New England 27,292 17,587 9,705 55.2% 18,551 (964) (5.2)%
New York 18,772 16,506 2,266 13.7% 13,642 2,864 21.0%
ERCOT 15,833 15,815 18 0.1% 19,912 (4,097) (20.6)%
Other Power Regions 24,576 22,750 1,826 8.0% 21,595 1,155 5.3%
Total Supply/Sales by Region 257,984 245,950 12,034 4.9% 247,518 (1,568) (0.6)%
(a) Includes the proportionate share of output where Generation has an undivided ownership interest in jointly-owned generating plants and includes the total output of plants that
are fully consolidated (e.g. CENG). Nuclear generation for the year ended December 31, 2015 includes physical volumes of 14,646 GWh in Mid-Atlantic and 18,769 GWh in New
York for CENG and for the year ended December 31, 2014 includes physical volumes of 11,409 GWh in Mid-Atlantic and 13,645 GWh in New York for CENG. Prior to the
integration date of April 1, 2014, CENG volumes were included in purchased power.
121
(a)
(a)
(b)
(b)
(c)
(d)
(d)
Source: BALTIMORE GAS & ELECTRIC CO, 10-K, February 10, 2016 Powered by Morningstar® Document Research℠
The information contained herein may not be copied, adapted or distributed and is not warranted to be accurate, complete or timely. The user assumes all risks for any damages or losses arising from any use of this information,
except to the extent such damages or losses cannot be limited or excluded by applicable law. Past financial performance is no guarantee of future results.