ComEd 2015 Annual Report Download - page 209
Download and view the complete annual report
Please find page 209 of the 2015 ComEd annual report below. You can navigate through the pages in the report by either clicking on the pages listed below, or by using the keyword search tool below to find specific information within the annual report.-
 1
1 -
2
-
3
-
4
-
5
-
6
-
7
-
8
-
9
-
10
-
11
-
12
-
13
-
14
-
15
-
16
-
17
-
18
-
19
-
20
-
21
-
22
-
23
-
24
-
25
-
26
-
27
-
28
-
29
-
30
-
31
-
32
-
33
-
34
-
35
-
36
-
37
-
38
-
39
-
40
-
41
-
42
-
43
-
44
-
45
-
46
-
47
-
48
-
49
-
50
-
51
-
52
-
53
-
54
-
55
-
56
-
57
-
58
-
59
-
60
-
61
-
62
-
63
-
64
-
65
-
66
-
67
-
68
-
69
-
70
-
71
-
72
-
73
-
74
-
75
-
76
-
77
-
78
-
79
-
80
-
81
-
82
-
83
-
84
-
85
-
86
-
87
-
88
-
89
-
90
-
91
-
92
-
93
-
94
-
95
-
96
-
97
-
98
-
99
-
100
-
101
-
102
-
103
-
104
-
105
-
106
-
107
-
108
-
109
-
110
-
111
-
112
-
113
-
114
-
115
-
116
-
117
-
118
-
119
-
120
-
121
-
122
-
123
-
124
-
125
-
126
-
127
-
128
-
129
-
130
-
131
-
132
-
133
-
134
-
135
-
136
-
137
-
138
-
139
-
140
-
141
-
142
-
143
-
144
-
145
-
146
-
147
-
148
-
149
-
150
-
151
-
152
-
153
-
154
-
155
-
156
-
157
-
158
-
159
-
160
-
161
-
162
-
163
-
164
-
165
-
166
-
167
-
168
-
169
-
170
-
171
-
172
-
173
-
174
-
175
-
176
-
177
-
178
-
179
-
180
-
181
-
182
-
183
-
184
-
185
-
186
-
187
-
188
-
189
-
190
-
191
-
192
-
193
-
194
-
195
-
196
-
197
-
198
-
 199
199 -
 200
200 -
 201
201 -
 202
202 -
 203
203 -
 204
204 -
 205
205 -
 206
206 -
 207
207 -
 208
208 -
 209
209 -
 210
210 -
 211
211 -
 212
212 -
 213
213 -
 214
214 -
 215
215 -
 216
216 -
 217
217 -
 218
218 -
 219
219 -
220
-
221
-
222
-
223
-
224
-
225
-
226
-
227
-
228
-
229
-
230
-
231
-
232
-
233
-
234
-
235
-
236
-
237
-
238
-
239
-
240
-
241
-
242
-
243
-
244
-
245
-
246
-
247
-
248
-
249
-
250
-
251
-
252
-
253
-
254
-
255
-
256
-
257
-
258
-
259
-
260
-
261
-
262
-
263
-
264
-
265
-
266
-
267
-
268
-
269
-
270
-
271
-
272
-
273
-
274
-
275
-
276
-
277
-
278
-
279
-
280
-
281
-
282
-
283
-
284
-
285
-
286
-
287
-
288
-
289
-
290
-
291
-
292
-
293
-
294
-
295
-
296
-
297
-
298
-
299
-
300
-
301
-
302
-
303
-
304
-
305
-
306
-
307
-
308
-
309
-
310
-
311
-
312
-
313
-
314
-
315
-
316
-
317
-
318
-
319
-
320
-
321
-
322
-
323
-
324
-
325
-
326
-
327
-
328
-
329
-
330
-
331
-
332
-
333
-
334
-
335
-
336
-
337
-
338
-
339
-
340
-
341
-
342
-
343
-
344
-
345
-
346
-
347
-
348
-
349
-
350
-
351
-
352
-
353
-
354
-
355
-
356
-
357
-
358
-
359
-
360
-
361
-
362
-
363
-
364
-
365
-
366
-
367
-
368
-
369
-
370
-
371
-
372
-
373
-
374
-
375
-
376
-
377
-
378
-
379
-
380
-
381
-
382
-
383
-
384
-
385
-
386
-
387
-
388
-
389
-
390
-
391
-
392
-
393
-
394
-
395
-
396
-
397
-
398
-
399
-
400
-
401
-
402
-
403
-
404
-
405
-
406
-
407
-
408
-
409
-
410
-
411
-
412
-
413
-
414
-
415
-
416
-
417
-
418
-
419
-
420
-
421
-
422
-
423
-
424
-
425
-
426
-
427
-
428
-
429
-
430
-
431
-
432
-
433
-
434
-
435
-
436
-
437
-
438
-
439
-
440
-
441
-
442
-
443
-
444
-
445
-
446
-
447
-
448
-
449
-
450
-
451
-
452
-
453
-
454
-
455
-
456
-
457
-
458
-
459
-
460
-
461
-
462
-
463
-
464
-
465
-
466
-
467
-
468
-
469
-
470
-
471
-
472
-
473
-
474
-
475
-
476
-
477
-
478
-
479
-
480
-
481
-
482
-
483
-
484
-
485
-
486
-
487
-
488
-
489
-
490
-
491
-
492
-
493
-
494
-
495
-
496
-
497
-
498
-
499
-
500
-
501
-
502
-
503
-
504
-
505
-
506
-
507
-
508
-
509
-
510
-
511
-
512
-
513
-
514
-
515
-
516
-
517
-
518
-
519
-
520
-
521
-
522
-
523
-
524
-
525
-
526
-
527
-
528
-
529
-
530
-
531
-
532
-
533
-
534
-
535
-
536
-
537
-
538
-
539
-
540
-
541
-
542
-
543
-
544
-
545
-
546
-
547
-
548
-
549
-
550
-
551
-
552
-
553
-
554
-
555
-
556
-
557
-
558
-
559
-
560
-
561
-
562
-
563
-
564
-
565
-
566
-
567
-
568
-
569
-
570
-
571
-
572
-
573
-
574
-
575
-
576
-
577
-
578
-
579
-
580
-
581
-
582
-
583
-
584
-
585
-
586
-
587
-
588
-
589
-
590
-
591
-
592
-
593
-
594
-
595
-
596
-
597
-
598
-
599
-
600
-
601
-
602
-
603
-
604
-
605
-
606
-
607
-
608
-
609
-
610
-
611
-
612
-
613
-
614
-
615
-
616
-
617
-
618
-
619
-
620
-
621
-
622
-
623
-
624
-
625
-
626
-
627
-
628
-
629
-
630
-
631
-
632
-
633
-
634
-
635
-
636
-
637
-
638
-
639
-
640
-
641
-
642
-
643
-
644
-
645
-
646
-
647
-
648
-
649
-
650
-
651
-
652
-
653
-
654
-
655
-
656
-
657
-
658
-
659
-
660
-
661
-
662
-
663
 |
 |

Table of Contents
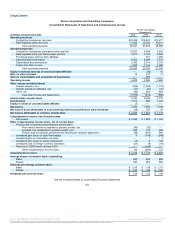
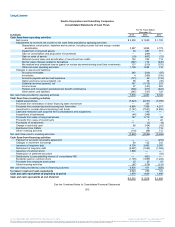
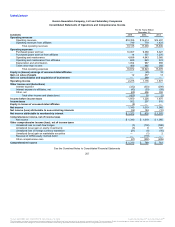
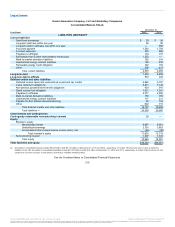
Exelon Corporation and Subsidiary Companies
Consolidated Statements of Cash Flows
For the Years Ended
December 31,
(In millions) 2015 2014 2013
Cash flows from operating activities
Net income $ 2,250 $ 1,820 $ 1,729
Adjustments to reconcile net income to net cash flows provided by operating activities:
Depreciation, amortization, depletion and accretion, including nuclear fuel and energy contract
amortization 3,987 3,868 3,779
Impairment of long-lived assets 36 687 171
Gain on consolidation and acquisition of businesses — (296) —
Gain on sales of assets (18) (437) (13)
Deferred income taxes and amortization of investment tax credits 752 502 119
Net fair value changes related to derivatives (367) 716 (445)
Net realized and unrealized losses (gains) on nuclear decommissioning trust fund investments 131 (210) (170)
Other non-cash operating activities 1,109 1,054 718
Changes in assets and liabilities:
Accounts receivable 240 (318) (97)
Inventories 4 (380) (100)
Accounts payable and accrued expenses (121) 49 (116)
Option premiums received (paid), net 58 38 (36)
Collateral received (posted), net 347 (1,719) 215
Income taxes 97 (143) 883
Pension and non-pension postretirement benefit contributions (502) (617) (422)
Other assets and liabilities (387) (157) 128
Net cash flows provided by operating activities 7,616 4,457 6,343
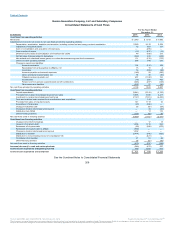
Cash flows from investing activities
Capital expenditures (7,624) (6,077) (5,395)
Proceeds from termination of direct financing lease investment — 335 —
Proceeds from nuclear decommissioning trust fund sales 6,895 7,396 4,217
Investment in nuclear decommissioning trust funds (7,147) (7,551) (4,450)
Cash and restricted cash acquired from consolidations and acquisitions — 140 —
Acquisitions of businesses (40) (386) —
Proceeds from sales of long-lived assets 147 1,719 32
Proceeds from sales of investments — 7 22
Purchases of investments — (3) (4)
Change in restricted cash 66 (104) (43)
Distribution from CENG — 13 115
Other investing activities (119) (88) 112
Net cash flows used in investing activities (7,822) (4,599) (5,394)
Cash flows from financing activities
Payment of accounts receivable agreement — — (210)
Changes in short-term borrowings 80 122 332
Issuance of long-term debt 6,709 3,463 2,055
Retirement of long-term debt (2,687) (1,545) (1,589)
Issuance of common stock 1,868 — —
Redemption of preferred securities — — (93)
Distributions to noncontrolling interest of consolidated VIE — (421) —
Dividends paid on common stock (1,105) (1,065) (1,249)
Proceeds from employee stock plans 32 35 47
Other financing activities (67) (178) (119)
Net cash flows provided by (used in) financing activities 4,830 411 (826)
Increase in cash and cash equivalents 4,624 269 123
Cash and cash equivalents at beginning of period 1,878 1,609 1,486
Cash and cash equivalents at end of period $ 6,502 $ 1,878 $ 1,609
See the Combined Notes to Consolidated Financial Statements
202
Source: BALTIMORE GAS & ELECTRIC CO, 10-K, February 10, 2016 Powered by Morningstar® Document Research℠
The information contained herein may not be copied, adapted or distributed and is not warranted to be accurate, complete or timely. The user assumes all risks for any damages or losses arising from any use of this information,
except to the extent such damages or losses cannot be limited or excluded by applicable law. Past financial performance is no guarantee of future results.