Cogeco 2002 Annual Report Download - page 15
Download and view the complete annual report
Please find page 15 of the 2002 Cogeco annual report below. You can navigate through the pages in the report by either clicking on the pages listed below, or by using the keyword search tool below to find specific information within the annual report.-
 1
1 -
2
-
3
-
4
-
 5
5 -
 6
6 -
 7
7 -
 8
8 -
 9
9 -
 10
10 -
 11
11 -
 12
12 -
 13
13 -
 14
14 -
 15
15 -
 16
16 -
 17
17 -
 18
18 -
 19
19 -
 20
20 -
 21
21 -
 22
22 -
 23
23 -
 24
24 -
 25
25 -
26
-
27
-
28
-
29
-
30
-
31
-
32
-
33
-
34
-
35
-
36
-
37
-
38
-
39
-
40
-
41
-
42
-
43
-
44
-
45
 |
 |

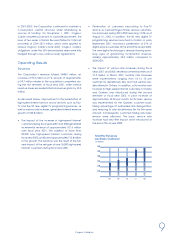
14 Cogeco Cable Inc.
Trading Volume of Subordinate Voting Shares
(The Toronto Stock Exchange)
(in thousands of shares)
9 8 9 9 0 0 0 1 0 2
Trading Statistics
Years ended August 31,
$50.00
$37.50
$25.00
$12.50
Trading Price of Subordinate
Voting Shares
(The Toronto Stock Exchange)
(in dollars)
16
12
8
4
Share Price/Cash Flow
Share Price/Shareholders’ Equity
9 4 9 5 9 6 9 7 9 8 9 9 0 0 0 1 0 2
9 3
Subordinate Voting Share Price and Ratios
Years ended August 31,
(in dollars, except ratios)
1 9 9 3 1 9 9 4 1 9 9 5 1 9 9 6 1 9 9 7 1 9 9 8 1 9 9 9 2 0 0 0 2 0 0 1 2 0 0 2
S u b o r dinate voting share
price at close $ 1 0 . 7 5 $ 1 0 . 5 0 $ 8 . 3 8 $ 8 . 2 0 $ 1 0 . 9 0 $ 1 4 . 6 5 $ 2 3 . 3 0 $ 4 2 . 5 0 $26.95 $11.50
Per share
Cash Flow 1 . 4 0 1 . 6 3 1 . 7 8 1 . 8 1 3 . 0 3 3 . 1 2 3 . 2 0 2 . 7 6 2.71 2.79
S h a r eholders’ equity 7 . 7 3 7 . 7 7 8 . 1 9 8 . 7 1 9 . 6 7 1 0 . 6 3 1 3 . 8 3 1 3 . 9 2 17.88 17.98
Ratios
S h a r e Price/Cash Flow 7 . 7 6 . 4 4 . 7 4 . 5 3 . 6 4 . 7 7 . 3 1 5 . 4 9.9 4.1
S h a r e Price/S h a r eholders’ equity 1 . 4 1 . 4 1 . 0 0 . 9 1 . 1 1 . 4 1 . 7 3 . 1 1 . 5 0 . 6
Share Price/Cash Flow
and Share Price/Shareholders’Equity
Years ended August 31,
24,000
12,000
9 8 9 9 0 0 0 1 0 2