Cogeco 2002 Annual Report Download - page 13
Download and view the complete annual report
Please find page 13 of the 2002 Cogeco annual report below. You can navigate through the pages in the report by either clicking on the pages listed below, or by using the keyword search tool below to find specific information within the annual report.-
 1
1 -
2
-
 3
3 -
 4
4 -
 5
5 -
 6
6 -
 7
7 -
 8
8 -
 9
9 -
 10
10 -
 11
11 -
 12
12 -
 13
13 -
 14
14 -
 15
15 -
 16
16 -
 17
17 -
 18
18 -
 19
19 -
 20
20 -
 21
21 -
 22
22 -
 23
23 -
24
-
25
-
26
-
27
-
28
-
29
-
30
-
31
-
32
-
33
-
34
-
35
-
36
-
37
-
38
-
39
-
40
-
41
-
42
-
43
-
44
-
45
 |
 |

12 Cogeco Cable Inc.
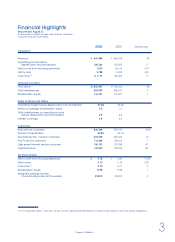
Income Taxes
Income taxes for fiscal year 2002 amounted to $4.9 million,
as compared to an income tax credit of $21.7 million
re c o rded in fiscal year 2001. Effective September 1, 2000,
the Corporation implemented new CICA re c o m m e n d a t i o n s
related to income taxes and, as a result, recorded a
reduction in future income taxes of $23.8 million in fiscal
year 2001 due to the reduction in future tax rate.
Excluding the effect of this adjustment in accounting
policy, income taxes would have been $2.1 million in
fiscal year 2001, leading to a $2.8 million increase in fiscal
year 2002. This increase is due to income before income
taxes in fiscal year 2002, compared to a loss before
income taxes the previous year. The loss resulted from
the $30.5 million write-off mentioned above, and from the
$10.4 million amortization of the customer base recorded
in fiscal year 2001.
Net Income
In fiscal year 2002, net income amounted to $3.8 million
or $0.10 per share, compared to $5.8 million or $0.15 per
share in fiscal year 2001.
Supplemental Discussion
— Accounting for Stock Options
During fiscal year 2002, 161,909 stock options were granted.
The Corporation early adopted the new CICA re c o m-
mendations re g a rding stock-based compensation. As
discussed in Note 12 on page 32, Cogeco Cable has val-
ued the granted options to provide the impact as if the
value of these options would have been expensed.
A c c o rdingly, expensing the options would have re d u c e d
net income by $314,000 in fiscal year 2002.
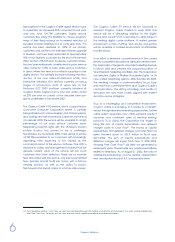
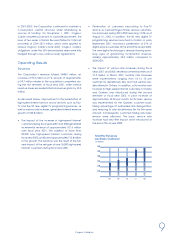
Cash Flow
In fiscal year 2002, Cash Flow totaled $111.2 million, an
increase of $5.8 million or 5.5% over fiscal year 2001. The
impact of changes in non-cash working capital items
amounted to a cash inflow of $16.5 million in fiscal year
2002, as compared to a cash outflow of $9.5 million in fiscal
year 2001. Unusual items required a cash outflow of
$4.9 million in fiscal year 2002, compared to unusual
items of $30.5 million requiring no cash outflow in fiscal
year 2001. On a per share basis, Cash Flow increased
from $2.71 in fiscal year 2001 to $2.79 in fiscal year 2002.
The 3.0% increase in Cash Flow per share was recorded
in spite of a 2.8% increase in the weighted average
number of outstanding shares, going from 38.8 million in
fiscal year 2001 to 39.9 million in fiscal year 2002. The
increase in the weighted average number of shares out-
standing is the result of shares issued in consideration of
cable systems acquired during 2001.
Investment activities resulted in $149.3 million of cash
outflow in 2001–2002, compared to $247.5 million in
2000–2001. The decrease in cash outflow related to
investment activities can be attributed to the decline in
the total of capital expenditures and deferred charges of
$17.7 million, and to the absence of business acquisitions
in fiscal year 2002. Drawing on the Te rm Facility, financing
activities generated cash inflow of $20.1 million in
2001–2002, compared to $151.6 million in 2000–2001.
Cash inflow from financing activities is due to the sum of
capital expenditures and deferred charges exceeding
Cash Flow and to business acquisitions in 2000–2001, as
further discussed.
Cash Flow
(in millions of dollars) (in dollars)
120 4.00
105 3.50
90 3.00
75 2.50
60 2.00
45 1.50
30 1.00
15 0.50
9 8 9 9 0 0 0 1 0 2
Cash Flow
(in millions of dollars) Cash Flow per Share
(in dollars)