Cogeco 2002 Annual Report Download - page 11
Download and view the complete annual report
Please find page 11 of the 2002 Cogeco annual report below. You can navigate through the pages in the report by either clicking on the pages listed below, or by using the keyword search tool below to find specific information within the annual report.-
 1
1 -
 2
2 -
 3
3 -
 4
4 -
 5
5 -
 6
6 -
 7
7 -
 8
8 -
 9
9 -
 10
10 -
 11
11 -
 12
12 -
 13
13 -
 14
14 -
 15
15 -
 16
16 -
 17
17 -
 18
18 -
 19
19 -
 20
20 -
 21
21 -
 22
22 -
23
-
24
-
25
-
26
-
27
-
28
-
29
-
30
-
31
-
32
-
33
-
34
-
35
-
36
-
37
-
38
-
39
-
40
-
41
-
42
-
43
-
44
-
45
 |
 |

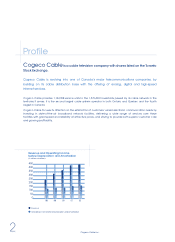
10 Cogeco Cable Inc.
The internal growth detailed above, was largely offset
by an internal revenue loss of $34.3 million, of which
$24.9 million relates to basic and extended tier customer
losses, to aggressive promotions, to certain price re d u c t i o n s ,
and to a decline of equipment rental revenue. Various
other sources contributed an additional $9.4 million to
the total internal revenue loss.
•The loss of basic and extended tier customers in fiscal
years 2001 and 2002 had a negative impact of
$16.4 million on revenue. The loss of over 42,000 cus-
tomers taking basic or basic and extended tiers, dur-
ing fiscal 2002, led to an $8.1 million decline in rev-
enue, while the full year impact of a net loss of over
22,000 customers taking basic or basic and extended
tiers, during fiscal year 2001, reduced re v e n u e by a
further $8.3 million.
• The total internal revenue loss from promotions or
price reductions amounted to $6.6 million in fiscal
2002. Since the beginning of fiscal year 2002, to main-
tain its competitive position in Ontario and Quebec,
the Corporation has off e r ed monthly pro m o t i o n a l
rebates to its new high-speed Internet customers.
These ranged from a total of $40 to $120 per new cus-
tomer during the various promotional periods com-
p a red to $40 per new customer in the prior fiscal y e a r.
In addition, the Corporation off e red pro g r a m m i n g
c redits of up to $100 per new digital customer buying
a digital terminal. Temporary $2 price reductions on
certain discretionary tiers in Ontario and perm a n e n t
$1 monthly rate reductions that benefited some
bundle customers were also introduced to impro v e
customer re t e n t i o n .
•During the third quarter of fiscal year 2001, Cogeco
Cable introduced a digital decoder sales program.
This program became more aggressive in September
2001 and offered promotions with selling prices as
low as $59.99, without programming credits. As of
August 31, 2002, 62% of decoders in service were
purchased, compared to 20% last year, and as a
result, rental revenue has decreased by $1.9 million
during 2001-2002.
Average monthly revenue per basic service customer
increased from $41.78 in 2000-2001 to $43.57 in 2001–
2002, a 4.3% increase. Most of this increase resulted from
improved penetration of high-speed Internet and digital
services.
Operating Costs
Network fees, shown as a percentage of re v e n u e ,
i n c reased in 2001–2002, resulting from program supplier
fee increases and from the introduction of new digital
channels with lower margins. Average monthly network
fees per basic service customer went from $12.82 in
2000–2001 to $13.82 in 2001–2002 resulting in a net incre a s e
of $1 per basic service customer. The following factors
explain this increase: program supplier fee increases, the
i n c reased number of customers subscribing to pro d u c t
bundling, the launch of ARTV (a new tier channel in
Quebec) and the launch of 50 specialty channels avail-
able on the Ontario digital product offering. The savings
related to the cancellation of Excite@HomeT M royalties, as
Cogeco Cable became a fully integrated service
p rovider in Ontario, partially offset the above mentionned
i n c re a s e s .
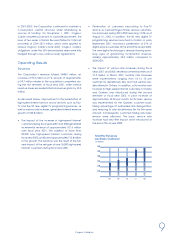
Operating Costs
include the following:
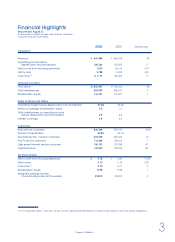
(in millions of dollars) % of % of
2002 revenue 2001 revenue
Network fees $142.1 31.7% $134.7 30.7%
Other operating costs 129.8 29.0 136.1 31.0
Management fees 7.7 1.7 7.5 1.7
To t a l $ 2 7 9 . 6 6 2 . 4 % $278.3 63.4%