Chesapeake Energy 2013 Annual Report Download - page 9
Download and view the complete annual report
Please find page 9 of the 2013 Chesapeake Energy annual report below. You can navigate through the pages in the report by either clicking on the pages listed below, or by using the keyword search tool below to find specific information within the annual report.-
 1
1 -
 2
2 -
 3
3 -
 4
4 -
 5
5 -
 6
6 -
 7
7 -
 8
8 -
 9
9 -
 10
10 -
 11
11 -
 12
12 -
 13
13 -
 14
14 -
 15
15 -
 16
16 -
 17
17 -
 18
18 -
 19
19 -
 20
20 -
21
-
22
-
23
-
24
-
25
-
26
-
27
-
28
-
29
-
30
-
31
-
32
-
33
-
34
-
35
-
36
-
37
-
38
-
39
-
40
-
41
-
42
-
43
-
44
-
45
-
46
-
47
-
48
-
49
-
50
-
51
-
52
-
53
-
54
-
55
-
56
-
57
-
58
-
59
-
60
-
61
-
62
-
63
-
64
-
65
-
66
-
67
-
68
-
69
-
70
-
71
-
72
-
73
-
74
-
75
-
76
-
77
-
78
-
79
-
80
-
81
-
82
-
83
-
84
-
85
-
86
-
87
-
88
-
89
-
90
-
91
-
92
-
93
-
94
-
95
-
96
-
97
-
98
-
99
-
100
-
101
-
102
-
103
-
104
-
105
-
106
-
107
-
108
-
109
-
110
-
111
-
112
-
113
-
114
-
115
-
116
-
117
-
118
-
119
-
120
-
121
-
122
-
123
-
124
-
125
-
126
-
127
-
128
-
129
-
130
-
131
-
132
-
133
-
134
-
135
-
136
-
137
-
138
-
139
-
140
-
141
-
142
-
143
-
144
-
145
-
146
-
147
-
148
-
149
-
150
-
151
-
152
-
153
-
154
-
155
-
156
-
157
-
158
-
159
-
160
-
161
-
162
-
163
-
164
-
165
-
166
-
167
-
168
-
169
-
170
-
171
-
172
-
173
-
174
-
175
-
176
-
177
-
178
-
179
-
180
 |
 |

1
PART I
Item 1. Business
Unless the context otherwise requires, references to “Chesapeake”, the “Company”, “us”, “we” and “our” in this
report are to Chesapeake Energy Corporation together with its subsidiaries. Our principal executive offices are located
at 6100 North Western Avenue, Oklahoma City, Oklahoma 73118, and our main telephone number at that location is
(405) 848-8000. Definitions of natural gas and oil industry terms appearing in this report can be found under Glossary
of Natural Gas and Oil Terms beginning on page 20. Please note that we have changed the oil and natural gas equivalent
reporting convention from that used in our previous reports to oil equivalent. Combined natural gas, oil and NGL volume
amounts are shown in barrels of oil equivalent (boe) rather than in thousand cubic feet of natural gas equivalent (mcfe).
Oil equivalent is based on six thousand cubic feet of natural gas to one barrel of oil or NGL.
Our Business
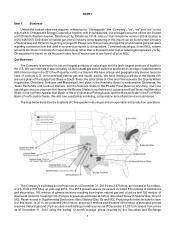
The Company is currently the second-largest producer of natural gas and the tenth-largest producer of liquids in
the U.S. We own interests in approximately 46,800 natural gas and oil wells that produced an average of approximately
665 mboe per day in the 2013 fourth quarter, net to our interest. We have a large and geographically diverse resource
base of onshore U.S. unconventional natural gas and liquids assets. We have leading positions in the liquids-rich
resource plays of the Eagle Ford Shale in South Texas; the Utica Shale in Ohio and Pennsylvania; the Granite Wash/
Hogshooter, Cleveland, Tonkawa and Mississippi Lime plays in the Anadarko Basin in northwestern Oklahoma, the
Texas Panhandle and southern Kansas; and the Niobrara Shale in the Powder River Basin in Wyoming. Our core
natural gas resource plays are the Haynesville/Bossier Shales in northwestern Louisiana and East Texas; the Marcellus
Shale in the northern Appalachian Basin of West Virginia and Pennsylvania; and the Barnett Shale in the Fort Worth
Basin of north-central Texas. We also own substantial marketing, compression and oilfield services businesses.
The map below illustrates the locations of Chesapeake's natural gas and oil exploration and production operations.
The Company's estimated proved reserves as of December 31, 2013 were 2.678 bboe, an increase of 63 mmboe,
or 2%, from 2.615 bboe at year-end 2012. The 2013 proved reserve movement included 524 mmboe of extensions
and discoveries, 162 mmboe of upward revisions resulting from higher natural gas and oil prices and 192 mmboe of
downward revisions resulting from changes to previous estimates as further discussed below in Natural Gas, Oil and
NGL Reserves and in Supplemental Disclosures About Natural Gas, Oil and NGL Producing Activities included in Item
8 of this report. In 2013, we produced 244 mmboe, acquired 2 mmboe and divested 189 mmboe of estimated proved
reserves. Natural gas and oil prices used in estimating proved reserves as of December 31, 2013 increased from prices
as of December 31, 2012 using the trailing 12-month average prices required by the Securities and Exchange