Chesapeake Energy 2013 Annual Report Download - page 17
Download and view the complete annual report
Please find page 17 of the 2013 Chesapeake Energy annual report below. You can navigate through the pages in the report by either clicking on the pages listed below, or by using the keyword search tool below to find specific information within the annual report.-
 1
1 -
2
-
3
-
4
-
5
-
6
-
 7
7 -
 8
8 -
 9
9 -
 10
10 -
 11
11 -
 12
12 -
 13
13 -
 14
14 -
 15
15 -
 16
16 -
 17
17 -
 18
18 -
 19
19 -
 20
20 -
 21
21 -
 22
22 -
 23
23 -
 24
24 -
 25
25 -
 26
26 -
 27
27 -
28
-
29
-
30
-
31
-
32
-
33
-
34
-
35
-
36
-
37
-
38
-
39
-
40
-
41
-
42
-
43
-
44
-
45
-
46
-
47
-
48
-
49
-
50
-
51
-
52
-
53
-
54
-
55
-
56
-
57
-
58
-
59
-
60
-
61
-
62
-
63
-
64
-
65
-
66
-
67
-
68
-
69
-
70
-
71
-
72
-
73
-
74
-
75
-
76
-
77
-
78
-
79
-
80
-
81
-
82
-
83
-
84
-
85
-
86
-
87
-
88
-
89
-
90
-
91
-
92
-
93
-
94
-
95
-
96
-
97
-
98
-
99
-
100
-
101
-
102
-
103
-
104
-
105
-
106
-
107
-
108
-
109
-
110
-
111
-
112
-
113
-
114
-
115
-
116
-
117
-
118
-
119
-
120
-
121
-
122
-
123
-
124
-
125
-
126
-
127
-
128
-
129
-
130
-
131
-
132
-
133
-
134
-
135
-
136
-
137
-
138
-
139
-
140
-
141
-
142
-
143
-
144
-
145
-
146
-
147
-
148
-
149
-
150
-
151
-
152
-
153
-
154
-
155
-
156
-
157
-
158
-
159
-
160
-
161
-
162
-
163
-
164
-
165
-
166
-
167
-
168
-
169
-
170
-
171
-
172
-
173
-
174
-
175
-
176
-
177
-
178
-
179
-
180
 |
 |

9
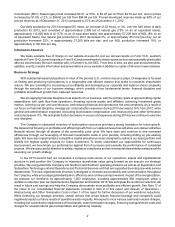
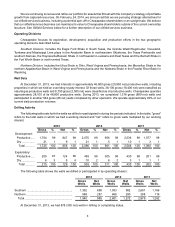
Costs Incurred in Natural Gas and Oil Property Acquisition, Exploration and Development
The following table sets forth historical costs incurred in natural gas and oil property acquisitions, exploration and
development activities during the periods indicated:
Years Ended December 31,
2013 2012 2011
($ in millions)
Acquisition of Properties:
Proved properties ................................................................................... $ 22 $ 332 $ 48
Unproved properties ............................................................................... 997 2,981 4,736
Exploratory costs ...................................................................................... 699 2,353 2,261
Development costs ................................................................................... 4,888 6,733 5,497
Costs incurred(a)(b) .............................................................................. $ 6,606 $ 12,399 $ 12,542
___________________________________________
(a) Exploratory and development costs are net of joint venture drilling and completion cost carries of $884 million,
$784 million and $2.570 billion in 2013, 2012 and 2011, respectively.
(b) Includes capitalized interest and asset retirement cost as follows:
Capitalized interest ........................................................................... $ 815 $ 976 $ 727
Asset retirement obligations ............................................................. $ 7 $ 32 $ 3
A summary of our exploration and development, acquisition and divestiture activities in 2013 by operating division
is as follows:
Gross
Wells
Drilled
Net
Wells
Drilled
Exploration
and
Development
Acquisition
of Unproved
Properties
Acquisition
of Proved
Properties
Sales of
Unproved
Properties
Sales of
Proved
Properties Total(a)
($ in millions)
Southern.. 1,352 698 $ 4,233 $ 169 $ 22 $ (1,252) $ (1,130) $ 2,042
Northern... 588 287 1,354 828 — (570) (411) 1,201
Total.... 1,940 985 $ 5,587 $ 997 $ 22 $ (1,822) $ (1,541) $ 3,243
___________________________________________
(a) Includes capitalized internal costs of $315 million and related capitalized interest of $815 million.
Acreage
The following table sets forth as of December 31, 2013 the gross and net developed and undeveloped natural
gas and oil leasehold and fee mineral acreage. "Gross" acres are the total number of acres in which we own a working
interest. "Net" acres refer to gross acres multiplied by our fractional working interest. Acreage numbers do not include
our unexercised options to acquire additional acreage.
Developed
Leasehold Undeveloped
Leasehold Fee Minerals Total
Gross
Acres Net
Acres Gross
Acres Net
Acres Gross
Acres Net
Acres Gross
Acres Net
Acres
(in thousands)
Southern.................. 6,528 3,271 4,376 2,724 127 18 11,031 6,013
Northern .................. 2,113 1,505 8,284 4,806 752 466 11,149 6,777
Total..................... 8,641 4,776 12,660 7,530 879 484 22,180 12,790
Most of our leases have a three- to five-year primary term, and we manage lease expirations to ensure that we
do not experience unintended material expirations. Our leasehold management efforts include scheduling our drilling
to establish production in paying quantities in order to hold leases by production, timely exercising our contractual
rights to pay delay rentals to extend the terms of leases we value, planning noncore divestitures to high-grade our