Chesapeake Energy 2013 Annual Report Download - page 10
Download and view the complete annual report
Please find page 10 of the 2013 Chesapeake Energy annual report below. You can navigate through the pages in the report by either clicking on the pages listed below, or by using the keyword search tool below to find specific information within the annual report.-
 1
1 -
 2
2 -
 3
3 -
 4
4 -
 5
5 -
 6
6 -
 7
7 -
 8
8 -
 9
9 -
 10
10 -
 11
11 -
 12
12 -
 13
13 -
 14
14 -
 15
15 -
 16
16 -
 17
17 -
 18
18 -
 19
19 -
 20
20 -
 21
21 -
22
-
23
-
24
-
25
-
26
-
27
-
28
-
29
-
30
-
31
-
32
-
33
-
34
-
35
-
36
-
37
-
38
-
39
-
40
-
41
-
42
-
43
-
44
-
45
-
46
-
47
-
48
-
49
-
50
-
51
-
52
-
53
-
54
-
55
-
56
-
57
-
58
-
59
-
60
-
61
-
62
-
63
-
64
-
65
-
66
-
67
-
68
-
69
-
70
-
71
-
72
-
73
-
74
-
75
-
76
-
77
-
78
-
79
-
80
-
81
-
82
-
83
-
84
-
85
-
86
-
87
-
88
-
89
-
90
-
91
-
92
-
93
-
94
-
95
-
96
-
97
-
98
-
99
-
100
-
101
-
102
-
103
-
104
-
105
-
106
-
107
-
108
-
109
-
110
-
111
-
112
-
113
-
114
-
115
-
116
-
117
-
118
-
119
-
120
-
121
-
122
-
123
-
124
-
125
-
126
-
127
-
128
-
129
-
130
-
131
-
132
-
133
-
134
-
135
-
136
-
137
-
138
-
139
-
140
-
141
-
142
-
143
-
144
-
145
-
146
-
147
-
148
-
149
-
150
-
151
-
152
-
153
-
154
-
155
-
156
-
157
-
158
-
159
-
160
-
161
-
162
-
163
-
164
-
165
-
166
-
167
-
168
-
169
-
170
-
171
-
172
-
173
-
174
-
175
-
176
-
177
-
178
-
179
-
180
 |
 |
2
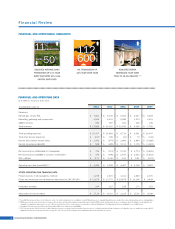
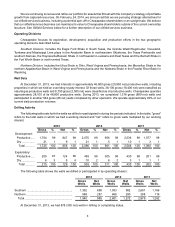
Commission (SEC). Natural gas prices increased $0.91, or 33%, to $3.67 per mcf from $2.76 per mcf, and oil prices
increased by $1.98, or 2%, to $96.82 per bbl from $94.84 per bbl. Proved developed reserves made up 68% of our
proved reserves as of December 31, 2013 compared to 57% as of December 31, 2012.
Our daily production for 2013 averaged 670 mboe, an increase of 22 mboe, or 3%, over the 648 mboe of daily
production for 2012, and consisted of approximately 2.999 bcf of natural gas (75% on an oil equivalent basis),
approximately 112,600 bbls of oil (17% on an oil equivalent basis) and approximately 57,200 bbls of NGL (8% on an
oil equivalent basis). Our natural gas production in 2013 decreased 3%, or approximately 85 mmcf per day; our oil
production increased 32%, or approximately 27,200 bbls per day; and our NGL production increased 19%, or
approximately 9,100 bbls per day.
Information About Us
We make available free of charge on our website at www.chk.com our annual reports on Form 10-K, quarterly
reports on Form 10-Q, current reports on Form 8-K, and amendments to those reports as soon as reasonably practicable
after we electronically file such material with, or furnish it to, the SEC. From time to time, we also post announcements,
updates, events, investor information and presentations on our website in addition to copies of all recent news releases.
Business Strategy
With substantial leasehold positions in most of the premier U.S. onshore resource plays, Chesapeake is focused
on finding and producing hydrocarbons in a responsible and efficient manner that seeks to maximize shareholder
returns. We are committed to increasing our profitability and decreasing our corporate and balance sheet complexity
through the execution of our business strategy, which consists of two fundamental tenets: financial discipline and
profitable and efficient growth from captured resources.
We are applying financial discipline to all aspects of our business, with the primary goals of approximating capital
expenditures with cash flow from operations, divesting noncore assets and affiliates, achieving investment grade
metrics, lowering our per unit cost structure, and reducing financial and operational risk and complexity. As a result of
our focus on financial discipline, average per unit production expenses during 2013 decreased 14% from 2012, while
general and administrative expenses (excluding stock-based compensation and restructuring and other termination
costs) decreased 17%. We anticipate further decreases in our per unit expenses during 2014 as we continue to exercise
cost discipline.
The Company’s substantial inventory of hydrocarbon resources provides a strong foundation for future growth.
We believe that focusing on profitable and efficient growth from our captured resources will allow us to deliver attractive
financial returns through all phases of the commodity price cycle. We have seen and continue to see increased
efficiencies through our leveraging of first-well investments made in prior periods, including drilling on pre-existing
pads. We have also implemented a competitive capital allocation process designed to optimize our asset portfolio and
identify the highest quality projects for future investment. To better understand our opportunities for continuous
improvement, we benchmark our performance against that of our peers and evaluate the performance of completed
projects. We also pay careful attention to safety, regulatory compliance and environmental stewardship measures while
executing our growth strategy.
In the 2013 second half, we conducted a company-wide review of our operations, assets and organizational
structure to best position the Company to maximize shareholder value going forward as we execute our strategic
priorities. We reorganized the Company into Northern and Southern operating divisions as well as an Exploration and
Subsurface Technology unit and Operations and Technical Services unit that are supported by enterprise-wide service
departments. The new organizational structure is designed to increase accountability and communication throughout
the Company, while encouraging standardization, efficiency and continuous improvement. As part of the reorganization,
we reduced our workforce by approximately 1,000 employees, including approximately 900 employees under a
workforce reduction plan we implemented in September and October 2013. We anticipate the workforce reduction will
result in future cost savings and help the Company demonstrate more profitable and efficient growth. See Note 17 of
the notes to our consolidated financial statements included in Item 8 of this report and Results of Operations -
Restructuring and Other Termination Costs in Item 7 of this report for further discussion of our workforce reductions.
While furthering our strategic priorities, certain actions that would reduce financial leverage and complexity could
negatively impact our future results of operations and/or liquidity. We expect to incur various cash and noncash charges,
including but not limited to impairments of fixed assets, lease termination charges, financing extinguishment costs and
charges for unused natural gas transportation and gathering capacity.