Chesapeake Energy 2013 Annual Report Download - page 12
Download and view the complete annual report
Please find page 12 of the 2013 Chesapeake Energy annual report below. You can navigate through the pages in the report by either clicking on the pages listed below, or by using the keyword search tool below to find specific information within the annual report.-
 1
1 -
 2
2 -
 3
3 -
 4
4 -
 5
5 -
 6
6 -
 7
7 -
 8
8 -
 9
9 -
 10
10 -
 11
11 -
 12
12 -
 13
13 -
 14
14 -
 15
15 -
 16
16 -
 17
17 -
 18
18 -
 19
19 -
 20
20 -
 21
21 -
 22
22 -
23
-
24
-
25
-
26
-
27
-
28
-
29
-
30
-
31
-
32
-
33
-
34
-
35
-
36
-
37
-
38
-
39
-
40
-
41
-
42
-
43
-
44
-
45
-
46
-
47
-
48
-
49
-
50
-
51
-
52
-
53
-
54
-
55
-
56
-
57
-
58
-
59
-
60
-
61
-
62
-
63
-
64
-
65
-
66
-
67
-
68
-
69
-
70
-
71
-
72
-
73
-
74
-
75
-
76
-
77
-
78
-
79
-
80
-
81
-
82
-
83
-
84
-
85
-
86
-
87
-
88
-
89
-
90
-
91
-
92
-
93
-
94
-
95
-
96
-
97
-
98
-
99
-
100
-
101
-
102
-
103
-
104
-
105
-
106
-
107
-
108
-
109
-
110
-
111
-
112
-
113
-
114
-
115
-
116
-
117
-
118
-
119
-
120
-
121
-
122
-
123
-
124
-
125
-
126
-
127
-
128
-
129
-
130
-
131
-
132
-
133
-
134
-
135
-
136
-
137
-
138
-
139
-
140
-
141
-
142
-
143
-
144
-
145
-
146
-
147
-
148
-
149
-
150
-
151
-
152
-
153
-
154
-
155
-
156
-
157
-
158
-
159
-
160
-
161
-
162
-
163
-
164
-
165
-
166
-
167
-
168
-
169
-
170
-
171
-
172
-
173
-
174
-
175
-
176
-
177
-
178
-
179
-
180
 |
 |

4
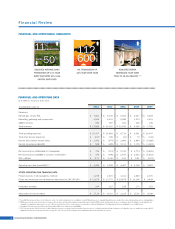
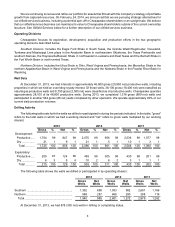
Production, Sales, Prices and Expenses
The following table sets forth information regarding the production volumes, natural gas, oil and NGL sales,
average sales prices received, other operating income and expenses for the periods indicated:
Years Ended December 31,
2013 2012 2011
Net Production:
Natural gas (bcf) ........................................................................................... 1,095 1,129 1,004
Oil (mmbbl) ................................................................................................... 41 31 17
NGL (mmbbl) ................................................................................................ 21 18 15
Oil equivalent (mmboe)(a) ...................................................................................... 244 237 199
Natural Gas, Oil and NGL Sales ($ in millions):
Natural gas sales .......................................................................................... $ 2,430 $ 2,004 $ 3,133
Natural gas derivatives - realized gains (losses) .......................................... 9 328 1,656
Natural gas derivatives - unrealized gains (losses) ...................................... (52) (331) (669)
Total natural gas sales.............................................................................. 2,387 2,001 4,120
Oil sales ........................................................................................................ 3,911 2,829 1,523
Oil derivatives - realized gains (losses) ........................................................ (108) 39 (60)
Oil derivatives - unrealized gains (losses) .................................................... 280 857 (128)
Total oil sales............................................................................................ 4,083 3,725 1,335
NGL sales ..................................................................................................... 582 526 603
NGL derivatives - realized gains (losses) ..................................................... — (9) (42)
NGL derivatives - unrealized gains (losses) ................................................. — 35 8
Total NGL sales ........................................................................................ 582 552 569
Total natural gas, oil and NGL sales..................................................... $ 7,052 $ 6,278 $ 6,024
Average Sales Price (excluding gains (losses) on derivatives):
Natural gas ($ per mcf) ................................................................................. $ 2.22 $ 1.77 $ 3.12
Oil ($ per bbl) ................................................................................................ $ 95.17 $ 90.49 $ 89.80
NGL ($ per bbl) ............................................................................................. $ 27.87 $ 29.89 $ 40.96
Oil equivalent ($ per boe) ............................................................................. $ 28.33 $ 22.61 $ 26.42
Average Sales Price (including realized gains (losses) on derivatives):
Natural gas ($ per mcf) ................................................................................. $ 2.23 $ 2.07 $ 4.77
Oil ($ per bbl) ................................................................................................ $ 92.53 $ 91.74 $ 86.25
NGL ($ per bbl) ............................................................................................. $ 27.87 $ 29.37 $ 38.12
Oil equivalent ($ per boe) ............................................................................. $ 27.92 $ 24.12 $ 34.23
Other Operating Income(b) ($ in millions):
Marketing, gathering and compression net margin....................................... $ 98 $ 119 $ 123
Oilfield services net margin .......................................................................... $ 159 $ 142 $ 119
Expenses ($ per boe):
Natural gas, oil and NGL production............................................................. $ 4.74 $ 5.50 $ 5.39
Production taxes ........................................................................................... $ 0.94 $ 0.79 $ 0.96
General and administrative expenses(c) ........................................................ $ 1.86 $ 2.26 $ 2.75
Natural gas, oil and NGL depreciation, depletion and amortization.............. $ 10.59 $ 10.58 $ 8.20
Depreciation and amortization of other assets ............................................. $ 1.28 $ 1.28 $ 1.46
Interest expense(d) ........................................................................................ $ 0.65 $ 0.35 $ 0.18