Chesapeake Energy 2013 Annual Report Download - page 14
Download and view the complete annual report
Please find page 14 of the 2013 Chesapeake Energy annual report below. You can navigate through the pages in the report by either clicking on the pages listed below, or by using the keyword search tool below to find specific information within the annual report.-
 1
1 -
2
-
3
-
 4
4 -
 5
5 -
 6
6 -
 7
7 -
 8
8 -
 9
9 -
 10
10 -
 11
11 -
 12
12 -
 13
13 -
 14
14 -
 15
15 -
 16
16 -
 17
17 -
 18
18 -
 19
19 -
 20
20 -
 21
21 -
 22
22 -
 23
23 -
 24
24 -
25
-
26
-
27
-
28
-
29
-
30
-
31
-
32
-
33
-
34
-
35
-
36
-
37
-
38
-
39
-
40
-
41
-
42
-
43
-
44
-
45
-
46
-
47
-
48
-
49
-
50
-
51
-
52
-
53
-
54
-
55
-
56
-
57
-
58
-
59
-
60
-
61
-
62
-
63
-
64
-
65
-
66
-
67
-
68
-
69
-
70
-
71
-
72
-
73
-
74
-
75
-
76
-
77
-
78
-
79
-
80
-
81
-
82
-
83
-
84
-
85
-
86
-
87
-
88
-
89
-
90
-
91
-
92
-
93
-
94
-
95
-
96
-
97
-
98
-
99
-
100
-
101
-
102
-
103
-
104
-
105
-
106
-
107
-
108
-
109
-
110
-
111
-
112
-
113
-
114
-
115
-
116
-
117
-
118
-
119
-
120
-
121
-
122
-
123
-
124
-
125
-
126
-
127
-
128
-
129
-
130
-
131
-
132
-
133
-
134
-
135
-
136
-
137
-
138
-
139
-
140
-
141
-
142
-
143
-
144
-
145
-
146
-
147
-
148
-
149
-
150
-
151
-
152
-
153
-
154
-
155
-
156
-
157
-
158
-
159
-
160
-
161
-
162
-
163
-
164
-
165
-
166
-
167
-
168
-
169
-
170
-
171
-
172
-
173
-
174
-
175
-
176
-
177
-
178
-
179
-
180
 |
 |

6
December 31, 2013. The prices used in our reserve reports were $3.67 per mcf of natural gas and $96.82 per
barrel of oil, before price differential adjustments. Including the effect of price differential adjustments, the prices
used in our reserve reports were $2.37 per mcf of natural gas, $95.89 per barrel of oil and $25.78 per barrel of
NGL. These prices should not be interpreted as a prediction of future prices, nor do they reflect the value of our
commodity derivative instruments in place as of December 31, 2013. The amounts shown do not give effect to
nonproperty-related expenses, such as corporate general and administrative expenses and debt service, or to
depreciation, depletion and amortization. The present value of estimated future net revenue differs from the
standardized measure only because the former does not include the effects of estimated future income tax
expenses ($4.3 billion as of December 31, 2013).
Management uses future net revenue, which is calculated without deducting estimated future income tax expenses,
and the present value thereof as a measure of the value of the Company's current proved reserves and to compare
relative values among peer companies. We also understand that securities analysts and rating agencies use this
measure in similar ways. While future net revenue and the present value thereof are based on prices, costs and
discount factors which are consistent from company to company, the standardized measure of discounted future
net cash flows is dependent on the unique tax situation of each individual company.
(c) Additional information on the standardized measure is presented in Supplemental Disclosures About Natural Gas,
Oil and NGL Producing Activities included in Item 8 of this report.
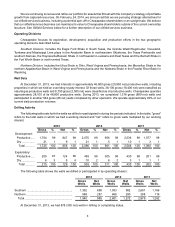
As of December 31, 2013, our reserve estimates included 869 mmboe of reserves classified as proved
undeveloped, compared to 1.124 bboe as of December 31, 2012. Presented below is a summary of changes in our
proved undeveloped reserves (PUDs) for 2013.
Total
(mmboe)
Proved undeveloped reserves, beginning of period ..................................................................... 1,124
Extensions, discoveries and other additions .......................................................................... 351
Revisions of previous estimates ............................................................................................ (355)
Developed .............................................................................................................................. (169)
Sale of reserves-in-place ....................................................................................................... (83)
Purchase of reserves-in-place ............................................................................................... 1
Proved undeveloped reserves, end of period ............................................................................... 869
As of December 31, 2013, there were no PUDs that had remained undeveloped for five years or more. In 2013,
we invested approximately $1.472 billion, net of drilling and completion cost carries of $79 million, to convert 169
mmboe of PUDs to proved developed reserves. In 2014, we estimate that we will invest approximately $1.506 billion,
net of drilling and completion cost carries of $150 million, for PUD conversion. The downward revision of 355 mmboe
of PUDs in 2013 related primarily to revised well spacing in our core development area in the Marcellus Shale, the
extension of our development plan beyond five years for locations outside the core of our Eagle Ford Shale acreage,
the removal of PUDs with only marginally economic estimated production, and a reduction in estimated PUD reserves
per well in the Mississippi Lime play.
The future net revenue attributable to our estimated proved undeveloped reserves of $17.921 billion as of
December 31, 2013, and the $6.305 billion present value thereof, has been calculated assuming that we will expend
approximately $8.567 billion to develop these reserves: $1.506 billion in 2014, $2.042 billion in 2015, $2.185 billion in
2016, $2.207 billion in 2017 and $600 million in 2018, although the amount and timing of these expenditures will depend
on a number of factors, including actual drilling results, service costs, commodity prices and the availability of capital.
Chesapeake's developmental drilling schedules are subject to revision and reprioritization throughout the year resulting
from unknowable factors such as the relative success in an individual developmental drilling prospect leading to an
additional drilling opportunity, title issues and infrastructure availability or constraints.
The SEC's rules for reporting reserves allow the booking of proved undeveloped reserves at locations greater
distances from producing wells than immediate offsets. All proved reserves are required to meet reasonable certainty
standards; thus, locations that are not direct offsets to producing wells must be shown to be underlain by the productive
formation. Reasonable certainty also requires that the formation is continuous between the producing wells and the
PUD locations and that the PUDs are economically viable.