Chesapeake Energy 2013 Annual Report Download - page 11
Download and view the complete annual report
Please find page 11 of the 2013 Chesapeake Energy annual report below. You can navigate through the pages in the report by either clicking on the pages listed below, or by using the keyword search tool below to find specific information within the annual report.-
 1
1 -
 2
2 -
 3
3 -
 4
4 -
 5
5 -
 6
6 -
 7
7 -
 8
8 -
 9
9 -
 10
10 -
 11
11 -
 12
12 -
 13
13 -
 14
14 -
 15
15 -
 16
16 -
 17
17 -
 18
18 -
 19
19 -
 20
20 -
 21
21 -
 22
22 -
23
-
24
-
25
-
26
-
27
-
28
-
29
-
30
-
31
-
32
-
33
-
34
-
35
-
36
-
37
-
38
-
39
-
40
-
41
-
42
-
43
-
44
-
45
-
46
-
47
-
48
-
49
-
50
-
51
-
52
-
53
-
54
-
55
-
56
-
57
-
58
-
59
-
60
-
61
-
62
-
63
-
64
-
65
-
66
-
67
-
68
-
69
-
70
-
71
-
72
-
73
-
74
-
75
-
76
-
77
-
78
-
79
-
80
-
81
-
82
-
83
-
84
-
85
-
86
-
87
-
88
-
89
-
90
-
91
-
92
-
93
-
94
-
95
-
96
-
97
-
98
-
99
-
100
-
101
-
102
-
103
-
104
-
105
-
106
-
107
-
108
-
109
-
110
-
111
-
112
-
113
-
114
-
115
-
116
-
117
-
118
-
119
-
120
-
121
-
122
-
123
-
124
-
125
-
126
-
127
-
128
-
129
-
130
-
131
-
132
-
133
-
134
-
135
-
136
-
137
-
138
-
139
-
140
-
141
-
142
-
143
-
144
-
145
-
146
-
147
-
148
-
149
-
150
-
151
-
152
-
153
-
154
-
155
-
156
-
157
-
158
-
159
-
160
-
161
-
162
-
163
-
164
-
165
-
166
-
167
-
168
-
169
-
170
-
171
-
172
-
173
-
174
-
175
-
176
-
177
-
178
-
179
-
180
 |
 |

3
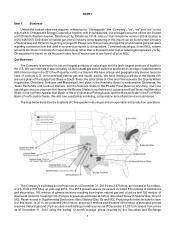
We are continuing to review and refine our portfolio for assets that fit best with the Company’s strategy of profitable
growth from captured resources. On February, 24, 2014, we announced that we are pursuing strategic alternatives for
our oilfield services business, including a potential spin-off to Chesapeake shareholders or an outright sale. We believe
that our oilfield services business can maximize its value to Chesapeake shareholders outside of the current ownership
structure. See Oilfield Services below for a further description of our oilfield services business.
Operating Divisions
Chesapeake focuses its exploration, development, acquisition and production efforts in the two geographic
operating divisions described below.
Southern Division. Includes the Eagle Ford Shale in South Texas, the Granite Wash/Hogshooter, Cleveland,
Tonkawa and Mississippi Lime plays in the Anadarko Basin in northwestern Oklahoma, the Texas Panhandle and
southern Kansas, the Haynesville/Bossier Shale in northwestern Louisiana and East Texas and the Barnett Shale in
the Fort Worth Basin in north-central Texas.
Northern Division. Includes the Utica Shale in Ohio, West Virginia and Pennsylvania, the Marcellus Shale in the
northern Appalachian Basin in West Virginia and Pennsylvania and the Niobrara Shale in the Powder River Basin in
Wyoming.
Well Data
At December 31, 2013, we had interests in approximately 46,800 gross (20,900 net) productive wells, including
properties in which we held an overriding royalty interest. Of these wells, 38,100 gross (18,400 net) were classified as
natural gas productive wells and 8,700 gross (2,500 net) were classified as oil productive wells. Chesapeake operates
approximately 28,100 of its 46,800 productive wells. During 2013, we completed 1,376 gross (899 net) wells and
participated in another 564 gross (86 net) wells completed by other operators. We operate approximately 90% of our
current daily production volumes.
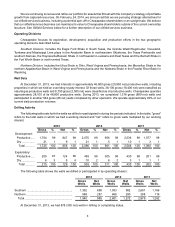
Drilling Activity
The following table sets forth the wells we drilled or participated in during the periods indicated. In the table, "gross"
refers to the total wells in which we had a working interest and "net" refers to gross wells multiplied by our working
interest.
2013 2012 2011
Gross % Net % Gross % Net % Gross % Net %
Development:
Productive ..... 1,704 99 847 99 2,075 99 956 99 2,536 99 1,077 99
Dry ................ 21 1 9 121 1 5 1 10 1 3 1
Total............ 1,725 100 856 100 2,096 100 961 100 2,546 100 1,080 100
Exploratory:
Productive ..... 209 97 124 96 495 98 305 98 430 99 201 99
Dry ................ 6 3 5 410 2 6 2 3 1 1 1
Total............ 215 100 129 100 505 100 311 100 433 100 202 100
The following table shows the wells we drilled or participated in by operating division:
2013 2012 2011
Gross
Wells Net
Wells Gross
Wells Net
Wells Gross
Wells Net
Wells
Southern ......................................................... 1,352 698 1,933 982 2,691 1,166
Northern .......................................................... 588 287 668 290 288 116
Total............................................................ 1,940 985 2,601 1,272 2,979 1,282
At December 31, 2013, we had 878 (335 net) wells in drilling or completing status.