Carphone Warehouse 2015 Annual Report Download - page 4
Download and view the complete annual report
Please find page 4 of the 2015 Carphone Warehouse annual report below. You can navigate through the pages in the report by either clicking on the pages listed below, or by using the keyword search tool below to find specific information within the annual report.-
 1
1 -
 2
2 -
 3
3 -
 4
4 -
 5
5 -
 6
6 -
 7
7 -
 8
8 -
 9
9 -
 10
10 -
 11
11 -
 12
12 -
 13
13 -
 14
14 -
 15
15 -
16
-
17
-
18
-
19
-
20
-
21
-
22
-
23
-
24
-
25
-
26
-
27
-
28
-
29
-
30
-
31
-
32
-
33
-
34
-
35
-
36
-
37
-
38
-
39
-
40
-
41
-
42
-
43
-
44
-
45
-
46
-
47
-
48
-
49
-
50
-
51
-
52
-
53
-
54
-
55
-
56
-
57
-
58
-
59
-
60
-
61
-
62
-
63
-
64
-
65
-
66
-
67
-
68
-
69
-
70
-
71
-
72
-
73
-
74
-
75
-
76
-
77
-
78
-
79
-
80
-
81
-
82
-
83
-
84
-
85
-
86
-
87
-
88
-
89
-
90
-
91
-
92
-
93
-
94
-
95
-
96
-
97
-
98
-
99
-
100
-
101
-
102
-
103
-
104
-
105
-
106
-
107
-
108
-
109
-
110
-
111
-
112
-
113
-
114
-
115
-
116
-
117
-
118
-
119
-
120
-
121
-
122
-
123
-
124
-
125
-
126
-
127
-
128
-
129
-
130
-
131
-
132
-
133
-
134
-
135
-
136
-
137
-
138
-
139
-
140
-
141
-
142
-
143
-
144
-
145
-
146
-
147
-
148
-
149
-
150
-
151
-
152
 |
 |

Dixons Carphone plc Annual Report and Accounts 2014/15
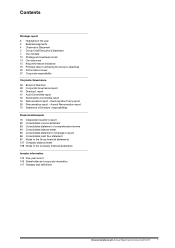
Strategic report
Highlights of the year
2
Dixons Carphone plc is Europe’s leading specialist electrical and
telecommunications retailer and services company, employing over
40,000 people in 9 countries.
• Group like-for-like revenue up 6%
• UK like-for-like revenue up 8%
• Group pro forma PBT of £381 million, up 21%
• Group pro forma EPS of 25.5p
• Strong balance sheet with year end pro forma net debt of £260 million
• Final dividend of 6.0p proposed, taking total dividends for the year to 8.5p
• Integration progressing well
• Disposals of non-core operations
0
2,000
4,000
6,000
8,000
1,0000
2014/15
9,936 9,752 9,517
2013/14 2012/13
0
100
200
300
400
500
2014/15
9,936 9,752 9,517
2013/14 2012/13
0
5
10
15
20
25
30
35
2014/15
9,936 9,752 9,517
2013/14 2012/13
414
359
310
29.7
18.6
10.9
Pro forma revenue (£million) Headline basic EPS (pence)Pro forma Headline EBIT (£million)
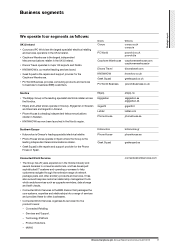
Our European store presence
Store numbers Own Franchised Total
UK and Ireland 1,328 — 1,328
Nordics 257 131 388
Southern Europe 369 223 592
1,954 354 2,308
Headline and pro forma performance measures are as defined in the Performance Review. Pro forma results are presented as if the CPW Europe Acquisition and the
Merger had occurred at the start of the comparative period. Headline figures for the year ended 29 March 2014 have been re-presented to exclude the results of
discontinued operations.