Carphone Warehouse 2015 Annual Report Download - page 17
Download and view the complete annual report
Please find page 17 of the 2015 Carphone Warehouse annual report below. You can navigate through the pages in the report by either clicking on the pages listed below, or by using the keyword search tool below to find specific information within the annual report.-
 1
1 -
2
-
3
-
4
-
5
-
6
-
 7
7 -
 8
8 -
 9
9 -
 10
10 -
 11
11 -
 12
12 -
 13
13 -
 14
14 -
 15
15 -
 16
16 -
 17
17 -
 18
18 -
 19
19 -
 20
20 -
 21
21 -
 22
22 -
 23
23 -
 24
24 -
 25
25 -
 26
26 -
 27
27 -
28
-
29
-
30
-
31
-
32
-
33
-
34
-
35
-
36
-
37
-
38
-
39
-
40
-
41
-
42
-
43
-
44
-
45
-
46
-
47
-
48
-
49
-
50
-
51
-
52
-
53
-
54
-
55
-
56
-
57
-
58
-
59
-
60
-
61
-
62
-
63
-
64
-
65
-
66
-
67
-
68
-
69
-
70
-
71
-
72
-
73
-
74
-
75
-
76
-
77
-
78
-
79
-
80
-
81
-
82
-
83
-
84
-
85
-
86
-
87
-
88
-
89
-
90
-
91
-
92
-
93
-
94
-
95
-
96
-
97
-
98
-
99
-
100
-
101
-
102
-
103
-
104
-
105
-
106
-
107
-
108
-
109
-
110
-
111
-
112
-
113
-
114
-
115
-
116
-
117
-
118
-
119
-
120
-
121
-
122
-
123
-
124
-
125
-
126
-
127
-
128
-
129
-
130
-
131
-
132
-
133
-
134
-
135
-
136
-
137
-
138
-
139
-
140
-
141
-
142
-
143
-
144
-
145
-
146
-
147
-
148
-
149
-
150
-
151
-
152
 |
 |

Dixons Carphone plc Annual Report and Accounts 2014/15
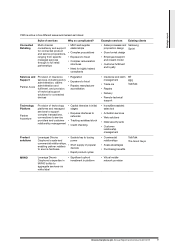
Strategic report
Key performance indicators
15
Financial and operational
Definition Performance
Total
Headline
sales*
Growth in total Headline sales. The ability to grow sales is an important
measure of a brand’s appeal to customers and its competitive position.
2014/15
£9,936m
2013/14†
£9,752m
Like-for-
like sales
Like-for-like sales are calculated based on Headline store and internet
sales using constant exchange rates. New stores are included where they
have been open for a full financial year both at the beginning and end of
the financial period. Sales from franchise stores are excluded and closed
stores are excluded for any period of closure during either period.
Customer support agreement, insurance and wholesale revenues along
with revenue from Connected World Services and other non-retail
businesses are excluded from like-for-like calculations. Revenue from
Carphone Warehouse SWAS are included in like-for-like.
2014/15
6%
2013/14†
4%
Market
position
In line with the Group’s strategy to be the leading specialist electrical and
mobile retailer in Europe, this is an important measure of how well
customers are being engaged by the Group’s brands in each market.
Retailing operations should be, or be capable of becoming, the number
one or number two specialist electrical retailer in their market, measured
by market share.
Market leading
positions in:
UK & Ireland
Nordics
Greece
Headline
EBIT*
Continued growth of Headline EBIT enables the Group to invest in its
future and provide a return for shareholders. Targets are set relative to
expected market performance.
2014/15
£414m
2013/14†
£359m
Headline
profit before
tax*
Continued growth of Headline profit before tax represents a measure of
Group performance to external investors and shareholders. Targets are
set relative to expected market performance.
2014/15
£381m
2013/14†
£316m
Free Cash
Flow*
The Group defines Free Cash Flow as net cash generated from
operations, less net finance costs, taxation and net capital expenditure
and excluding certain discrete items such as special pension
contributions. The management of cash usage, in particular working
capital employed in the business, optimises resources available for the
Group to invest in its future growth and to generate shareholder value.
2014/15
£(112)m
2013/14†
£280m
Return on
Capital
Employed
(ROCE)
The Group calculates ROCE on a pre-tax and lease adjusted basis. The
return is based on Headline EBIT, adjusted to add back the estimated
interest component associated with capitalising operating lease costs.
Capital employed is based on net assets including capitalised leases, but
excluding goodwill, cash, tax and the defined benefit pension obligations.
The calculation is performed on a moving annual total in order to best
match the return on assets in a year with the assets in use during the
year to generate the return.
2014/15
20%
2013/14†
N/A
Shareholder
Definition Performance
Headline basic
earnings per
share* (EPS)
The level of growth in EPS provides a suitable measure of the financial
health of the Group and its ability to deliver returns to shareholders
each year. The Group targets growth in EPS commensurate with growth
in earnings.
2014/15
25.5p
2013/14†
20.5p
Total
shareholder
return (TSR)
This metric provides a relative performance measure over the longer term
of the Group’s ability to deliver returns for shareholders. The Group
previously used the FTSE 250 index but in 2015 changed to measure
itself against the FTSE 350 index reflecting the Group’s increased
market capitalisation.
3 Year Compound Annual Growth
Dixons Carphone plc 44%
FTSE 350 Index 12%
* Headline performance measures are as defined in the Performance Review. These have been reported on a pro forma basis as if the CPW
Europe Acquisition and the Merger had occurred at the start of the comparative period.
† Headline figures for the year ended 29 March 2014 have been re-presented to exclude the results of discontinued operations.