Canon 2005 Annual Report Download - page 6
Download and view the complete annual report
Please find page 6 of the 2005 Canon annual report below. You can navigate through the pages in the report by either clicking on the pages listed below, or by using the keyword search tool below to find specific information within the annual report.-
 1
1 -
 2
2 -
 3
3 -
 4
4 -
 5
5 -
 6
6 -
 7
7 -
 8
8 -
 9
9 -
 10
10 -
 11
11 -
 12
12 -
 13
13 -
 14
14 -
 15
15 -
 16
16 -
 17
17 -
18
-
19
-
20
-
21
-
22
-
23
-
24
-
25
-
26
-
27
-
28
-
29
-
30
-
31
-
32
-
33
-
34
-
35
-
36
-
37
-
38
-
39
-
40
-
41
-
42
-
43
-
44
-
45
-
46
-
47
-
48
-
49
-
50
-
51
-
52
-
53
-
54
-
55
-
56
-
57
-
58
-
59
-
60
-
61
-
62
-
63
-
64
-
65
-
66
-
67
-
68
-
69
-
70
-
71
-
72
-
73
-
74
-
75
-
76
-
77
-
78
-
79
-
80
-
81
-
82
-
83
-
84
-
85
-
86
-
87
-
88
-
89
-
90
 |
 |

4
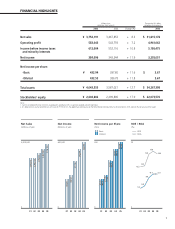
Canon turned out another exceptional performance in fiscal
2005, the final year of Phase II of our Excellent Global
Corporation Plan, achieving record earnings and marking the
sixth consecutive year of increases in sales and profits.
Consolidated net sales grew 8.3% to ¥3,754.2 billion
(US$31,815 million), income before income taxes and minority
interests increased 10.8% to ¥612.0 billion (US$5,186 million),
and net income reached ¥384.1 billion (US$3,255 million), up
11.9% from the previous year. We recorded higher revenues in
all major product segments, as well as in all operating regions.
Overview of Fiscal 2005
The global economy in 2005 enjoyed solid growth in spite of
continually high crude oil prices. The U.S. economy demon-
strated resilience, China maintained a high annual growth
rate, and the European economy regained momentum.
Japan’s economy showed signs of a recovery with sound
corporate capital spending. The average value of the yen for
the year was ¥110.58 to the U.S. dollar and ¥137.04 to the
euro, representing a year-on-year decrease of almost 2%
against both currencies.
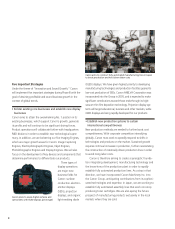
Under these circumstances, Canon products were in strong
demand and received critical acclaim. Factors contributing to net
sales growth included increased sales volume of core products,
including multifunction devices (MFDs), color printers, digital
cameras, interchangeable camera lenses, and exposure equipment
used to produce liquid crystal display (LCD) panels. In terms of
sales by product segment, business machines rose 4.8% to
¥2,502.4 billion (US$21,207 million), cameras surged 15.2% to
¥879.2 billion (US$7,451 million), and optical and other products
climbed 17.6% to ¥372.6 billion (US$3,158 million).
Despite escalating raw-material prices and other negative
factors, the gross profit ratio remained at a high 48.5% owing to
cost reductions realized through production- and procurement-
reform efforts. The figure represented a year-on-year decrease of
0.9 points.
Basic net income per share amounted to ¥432.94 (US$3.67),
an increase of ¥45.14 from a year earlier. Based on these strong
results and our financial standing, we increased the annual divi-
dend by ¥35, bringing the total to ¥100 (US$0.85) per share.
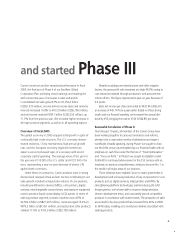
Successful Conclusion of Phase II
Over the past 10 years, all members of the Canon Group have
been working together to carry out innovations and reforms,
aiming to be a corporation worthy of admiration and respect
worldwide. Broadly speaking, during Phase I we sought to close
out the 20th century by strengthening our financial health with an
emphasis on cash flow under the themes of “Total Optimization”
and “Focus on Profit.” In Phase II we sought to establish a solid
foothold for continued advancement in the 21st century with an
emphasis on product competitiveness, aiming to become No. 1 in
the world in all major areas of our business.
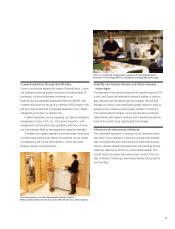
These initiatives have enabled Canon to make great strides in
development and in-house production of key components for core
products such as digital cameras, inkjet printers and MFDs. By
strengthening platform technologies and introducing 3D-CAD
design systems, we’ve been able to improve design precision,
shorten development times, and consistently launch competitive
products in accordance with market needs. The proportion of sales
accounted for by new products has increased from 44% in 2000
to 66% today, enabling us to avoid price declines associated with
existing products.
and started Phase III