Canon 2005 Annual Report Download - page 3
Download and view the complete annual report
Please find page 3 of the 2005 Canon annual report below. You can navigate through the pages in the report by either clicking on the pages listed below, or by using the keyword search tool below to find specific information within the annual report.-
 1
1 -
 2
2 -
 3
3 -
 4
4 -
 5
5 -
 6
6 -
 7
7 -
 8
8 -
 9
9 -
 10
10 -
 11
11 -
 12
12 -
 13
13 -
 14
14 -
15
-
16
-
17
-
18
-
19
-
20
-
21
-
22
-
23
-
24
-
25
-
26
-
27
-
28
-
29
-
30
-
31
-
32
-
33
-
34
-
35
-
36
-
37
-
38
-
39
-
40
-
41
-
42
-
43
-
44
-
45
-
46
-
47
-
48
-
49
-
50
-
51
-
52
-
53
-
54
-
55
-
56
-
57
-
58
-
59
-
60
-
61
-
62
-
63
-
64
-
65
-
66
-
67
-
68
-
69
-
70
-
71
-
72
-
73
-
74
-
75
-
76
-
77
-
78
-
79
-
80
-
81
-
82
-
83
-
84
-
85
-
86
-
87
-
88
-
89
-
90
 |
 |

1
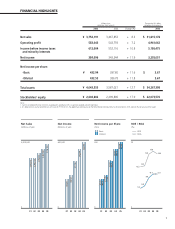
FINANCIAL HIGHLIGHTS
2005 2004 Change (%) 2005
Net sales
Operating profit
Income before income taxes
and minority interests
Net income
Net income per share:
-Basic
-Diluted
Total assets
Stockholders’ equity
¥ 3,754,191
583,043
612,004
384,096
¥ 432.94
432.55
¥ 4,043,553
¥ 2,604,682
3,467,853
543,793
552,116
343,344
387.80
386.78
3,587,021
2,209,896
+ 8.3
+ 7.2
+ 10.8
+ 11.9
+ 11.6
+ 11.8
+ 12.7
+ 17.9
$ 31,815,178
4,941,042
5,186,475
3,255,051
$ 3.67
3.67
$ 34,267,398
$ 22,073,576
Notes:
1. Canon’s consolidated financial statements are prepared in accordance with U.S. generally accepted accounting principles.
2. U.S. dollar amounts are translated from yen at the rate of JPY118=U.S.$1, the approximate exchange rate on the Tokyo Foreign Exchange Market as of December 30, 2005, solely for the convenience of the reader.
Millions of yen
(except per share amounts)
Thousands of U.S. dollars
(except per share amounts)
4,000,000
Net Sales
01 02 03 04 05
400,000
Net Income
01 02 03 04 05
450
01 02 03 04 05
20
ROE / ROA
01 02 03 04 05
Basic
Diluted
ROE
ROA
Net Income per Share
0000
2,907,573
2,940,128
3,198,072
3,467,853
3,754,191
167,561
190,737
275,730
343,344
384,096
191.29
217.56
313.81
387.80
432.94
12.2
12.5
15.9
16.8
5.9
6.6
9.0
10.1 10.1
188.70
214.80
310.75
386.78
432.55
16.0
(Millions of yen) (Millions of yen) (Yen) (%)