Barclays 2015 Annual Report Download - page 4
Download and view the complete annual report
Please find page 4 of the 2015 Barclays annual report below. You can navigate through the pages in the report by either clicking on the pages listed below, or by using the keyword search tool below to find specific information within the annual report.
Barclays has a number of industry leading businesses that produce
excellent returns, but this is not universal across the portfolio. Personal
and Corporate Banking and Barclaycard together produce profits after
tax of £3.3bn and a combined return on equity of 13.4%. The other
segments however fared less well and produced returns below the
Group’s hurdle rate. Barclays Africa profits, although strong in local
currency, were significantly impacted by the decline in the Rand and by
the UK bank levy, bringing sterling returns down to an after-tax profit of
£0.3bn and a return on equity of 8.7%. Also, while doubling over the
prior year, the Investment Bank’s profit of £0.8bn generated an
improved, but still substandard, return on equity of 5.6%, up from 2.7%.
Our core businesses overall produced a profit before tax of £6.9bn and
a return on equity of 9%. While respectable, this of course is below our
required return and needs to be improved. On the other hand, this profit
was fully eroded by the £1.5bn drag of the non-core portfolio, £4.0bn in
litigation and conduct charges relating to historical matters (in addition
to the £0.4bn included in the core and non-core business results), and
£1.5bn in corporate income taxes contributing to an overall loss for our
ordinary shareholders of £0.4bn. Since conduct and related charges are
no longer tax deductible, Barclays tax rate for last year was effectively
70%. If the £0.5bn cost of the UK bank levy is added to corporate
income taxes, the effective ‘tax’ rate rises to 76%. The extent of the UK
tax we bear was reflected in the results of PwC’s 2015 survey of the One
Hundred Group, which represents most of the UK’s largest groups and
concluded that Barclays paid the greatest amount of UK tax.
Of course with respect to our underlying profitability and the scale of the
charges against this, things cannot stay the same. Tough situations like
this demand effective action.
New Leadership
As an important starting point, the Board decided that new leadership
was required. In July, we announced the departure of Antony Jenkins as
Chief Executive and in October the appointment of Jes Staley, like me, a
banking veteran. While I was able to exercise executive responsibility in
an interim capacity immediately following Antony’s departure, and was
able to set a number of initiatives in train, we were particularly fortunate
that Jes was able to be active so quickly.
Jes has made good progress in building his new management team. In
short order, he has appointed Ashok Vaswani as head of Barclays UK
with responsibility for the establishment of the new Ring-Fenced Bank.
Jes has also recruited Paul Compton as Chief Operating Officer and
C.S. Venkatakrishnan as Chief Risk Officer.
Back to Core
The Board recently reflected on the strategy and situation of the Group
and decided that our strategic core was our UK retail and small business
franchise, our international Corporate and Investment Banking business
largely centred around our trading hubs in London, New York and Asia,
and our international credit card businesses. The remainder of the Group
was therefore designated non-core, and to be exited, in addition to the
continued rundown of the heritage non-core portfolio.
We therefore decided, subject to shareholder and regulatory approval, to
take our ownership of Barclays Africa Group Limited to a level where we
can achieve accounting and regulatory deconsolidation as soon as this
can be executed. We have sold, or are in the process of exiting, the
balance of retail banking operations outside the UK. We have also sold,
or put up for sale, our international Private Banking businesses other
than the UK region, Monaco and Geneva. In the Investment Bank, we
withdrew from nine countries, cash equities trading other than in New
York and London, all local currency trading outside our major hubs, and
certain securitised products trading in the US. The capital released will
be used to underpin our capital strength going forward.
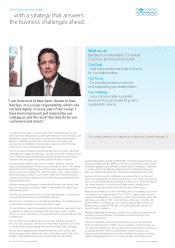
“Banking is in the eye of a perfect storm. It was
in full consciousness of this, that I undertook
the role as your Chairman at the end of April,
with the strong conviction that we could not
only stabilise the situation relatively quickly,
but also return the Group to prosperity during
my tenure.”
In such an environment it is so easy to become consumed by challenges,
market volatility and the short-termism of the financial markets, but this
tends to obscure the underlying quality of the Barclays brand and
franchise, the genuine and substantive progress that the Group has
made in recent years and the potential for the organisation arising from
the decisions and actions we are now taking for the future.
Today the Group is smaller, safer, more focused, less leveraged, better
capitalised and highly liquid. Comparing 2015 with 2008, we find:
£2.1trn in assets historically against £1.1trn and declining
shareholders’ equity was £36.6bn, and is now £54.5bn
balance sheet leverage (total assets to ordinary shareholders’ funds)
was 56 times and is now 20 times and comparable to more highly-
rated peers
shareholders’ equity as a percentage of risk weighted assets (RWAs)
was 8.5% and is now 15.2%.
While we will continue this journey towards greater financial strength,
the main issue for the Group is no longer capital as some remark, but
earnings and returns. Put simply, for the past few years and including
last year, we have produced either negligible retained profits or losses
before dividends. Going forward, we need to reverse this and generate
superior returns out of our franchise. This said, we also needed to take
action to preserve and enhance our capital in unpredictable times. To
this end, while we declared the full year 2015 dividend in line with
guidance, we also decided it would be prudent to scale back dividends
in 2016 and 2017, until such time as we can cover them from earnings.
02 I Barclays PLC Annual Report 2015 home.barclays/annualreport
Chairman’s letter
Addressing the issues facing Barclays today…

