Barclays 2015 Annual Report Download - page 18
Download and view the complete annual report
Please find page 18 of the 2015 Barclays annual report below. You can navigate through the pages in the report by either clicking on the pages listed below, or by using the keyword search tool below to find specific information within the annual report.-
 1
1 -
2
-
3
-
4
-
5
-
6
-
7
-
 8
8 -
 9
9 -
 10
10 -
 11
11 -
 12
12 -
 13
13 -
 14
14 -
 15
15 -
 16
16 -
 17
17 -
 18
18 -
 19
19 -
 20
20 -
 21
21 -
 22
22 -
 23
23 -
 24
24 -
 25
25 -
 26
26 -
 27
27 -
 28
28 -
29
-
30
-
31
-
32
-
33
-
34
-
35
-
36
-
37
-
38
-
39
-
40
-
41
-
42
-
43
-
44
-
45
-
46
-
47
-
48
-
49
-
50
-
51
-
52
-
53
-
54
-
55
-
56
-
57
-
58
-
59
-
60
-
61
-
62
-
63
-
64
-
65
-
66
-
67
-
68
-
69
-
70
-
71
-
72
-
73
-
74
-
75
-
76
-
77
-
78
-
79
-
80
-
81
-
82
-
83
-
84
-
85
-
86
-
87
-
88
-
89
-
90
-
91
-
92
-
93
-
94
-
95
-
96
-
97
-
98
-
99
-
100
-
101
-
102
-
103
-
104
-
105
-
106
-
107
-
108
-
109
-
110
-
111
-
112
-
113
-
114
-
115
-
116
-
117
-
118
-
119
-
120
-
121
-
122
-
123
-
124
-
125
-
126
-
127
-
128
-
129
-
130
-
131
-
132
-
133
-
134
-
135
-
136
-
137
-
138
-
139
-
140
-
141
-
142
-
143
-
144
-
145
-
146
-
147
-
148
-
149
-
150
-
151
-
152
-
153
-
154
-
155
-
156
-
157
-
158
-
159
-
160
-
161
-
162
-
163
-
164
-
165
-
166
-
167
-
168
-
169
-
170
-
171
-
172
-
173
-
174
-
175
-
176
-
177
-
178
-
179
-
180
-
181
-
182
-
183
-
184
-
185
-
186
-
187
-
188
-
189
-
190
-
191
-
192
-
193
-
194
-
195
-
196
-
197
-
198
-
199
-
200
-
201
-
202
-
203
-
204
-
205
-
206
-
207
-
208
-
209
-
210
-
211
-
212
-
213
-
214
-
215
-
216
-
217
-
218
-
219
-
220
-
221
-
222
-
223
-
224
-
225
-
226
-
227
-
228
-
229
-
230
-
231
-
232
-
233
-
234
-
235
-
236
-
237
-
238
-
239
-
240
-
241
-
242
-
243
-
244
-
245
-
246
-
247
-
248
-
249
-
250
-
251
-
252
-
253
-
254
-
255
-
256
-
257
-
258
-
259
-
260
-
261
-
262
-
263
-
264
-
265
-
266
-
267
-
268
-
269
-
270
-
271
-
272
-
273
-
274
-
275
-
276
-
277
-
278
-
279
-
280
-
281
-
282
-
283
-
284
-
285
-
286
-
287
-
288
-
289
-
290
-
291
-
292
-
293
-
294
-
295
-
296
-
297
-
298
-
299
-
300
-
301
-
302
-
303
-
304
-
305
-
306
-
307
-
308
-
309
-
310
-
311
-
312
-
313
-
314
-
315
-
316
-
317
-
318
-
319
-
320
-
321
-
322
-
323
-
324
-
325
-
326
-
327
-
328
-
329
-
330
-
331
-
332
-
333
-
334
-
335
-
336
-
337
-
338
-
339
-
340
-
341
-
342
-
343
-
344
-
345
-
346
-
347
-
348
-
349
-
350
-
351
-
352
-
353
-
354
-
355
-
356
 |
 |

16 I Barclays PLC Annual Report 2015 home.barclays/annualreport
How we are doing
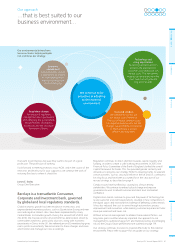
…effectively managing risk to create
sustainable returns for our Company.
What we are doing
We are committed to delivering long-term acceptable returns to
shareholders in a sustainable way, while maintaining adequate levels
of capital to enable the Bank to operate safely through challenging
economic conditions.
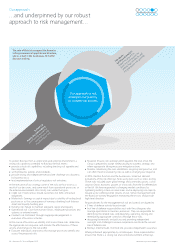
We will achieve this by prudently optimising the level, mix and
distribution to businesses of our capital resources whilst maintaining
sufficient capital resources in order to:
ensure the Group is well capitalised relative to its minimum
regulatory capital requirements set by the PRA and other
regulatory authorities
support its credit rating
support its growth and strategic objectives.
Balanced Scorecard metric
Actual
2015
Actual
2014
Actual
2013 a
Fully loaded CRD IV CET1 ratio 11.4% 10.3% 9.1%
Return on Equity (Adjusted) 4.9% 5.1% 4.3%
Note
a 2013 Return on Equity (Adjusted) has been revised to account for
the reclassification of £173m of charges, relating to a US residential
mortgage related business settlement with the Federal Housing
Finance Agency, to provisions for ongoing investigations and
litigation including Foreign Exchange to aid comparability.
How we measure success
Fully Loaded CRD IV CET1 ratio
The Fully loaded CRD IV CET1 ratio demonstrates the
capital strength and resilience of Barclays. By ensuring
we are well capitalised relative to minimum capital
requirements of regulatory authorities, we create a
safer bank for customers and clients, and all
stakeholders through challenging economic conditions.
The ratio expresses Barclays’ capital as a percentage of
risk weighted assets (RWAs), as defined by the PRA, in
the context of CRD IV (an EU Directive prescribing
capital adequacy and liquidity requirements), and is
part of the regulatory framework governing how banks
and depository institutions are supervised.
Adjusted Return on Equity (RoE)
Adjusted RoE measures the organisation’s ability to
generate acceptable returns for shareholders.
Adjusted RoE is calculated as adjusted profit for the
year attributable to ordinary equity holders of the
parent divided by average shareholders’ equity for the
year excluding non-controlling and other equity
interests. It excludes certain items, including those that
are significant but not representative of the underlying
business performance.
How we are doing
Fully loaded CRD IV CET1 ratio
In 2015 the Group’s CET1 ratio increased by 110 basis points to 11.4%.
The main driver was a £44bn reduction in RWAs to £358bn,
demonstrating continued progress on the Non-Core rundown together
with reductions in the Investment Bank. This was partially offset by a
decrease in CET1 capital to £40.7bn (2014: £41.5bn). We will continue
to reduce RWAs within Non-Core, while looking to allocate capital to RoE
enhancing growth opportunities in our Core businesses.
Adjusted Return on Equity
Adjusted RoE in 2015 decreased to 4.9% (2015: 5.1%) as adjusted PBT
fell by 2% to £5,403m, driven by a 24% increase in the Non-Core loss
before tax to £1,459m as a result of the continued rundown, partially
offset by a 3% increase in Core profit before tax to £6,862m. Adjusted
RoE for Core was 9.0% (2014: 9.2%).
The Group estimates its cost of equity for 2016 at 10.5%.
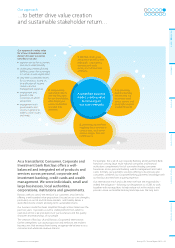
STAKEHOLDER PERFORMANCE
Case study
Our Non-Core division is responsible for the divestment of Barclays
non-strategic assets and businesses, and is run by a dedicated
management team operating within a clear governance framework
to rundown the unit while optimising shareholder value.
When the Non-Core division was created in May 2014, RWAs were
£110bn. By the end of 2015, this had reduced to £47bn as a result
of the disposal of Businesses, the rundown and exit of Securities
and Loans, and Derivative risk reductions. Key drivers of the decrease
in RWAs of £29bn in 2015 were a £10bn reduction in the Derivative
portfolio, £9bn reduction in Securities and Loans, and reductions
as a result of the sale of the Spanish and UK Secured Lending
businesses. The announced sale of the Portuguese and Italian retail
businesses in H215, due to be completed in H116, are expected to
result in a further £2.5bn reduction in Non-Core RWAs.