Barclays 2005 Annual Report Download - page 15
Download and view the complete annual report
Please find page 15 of the 2005 Barclays annual report below. You can navigate through the pages in the report by either clicking on the pages listed below, or by using the keyword search tool below to find specific information within the annual report.-
 1
1 -
2
-
3
-
4
-
 5
5 -
 6
6 -
 7
7 -
 8
8 -
 9
9 -
 10
10 -
 11
11 -
 12
12 -
 13
13 -
 14
14 -
 15
15 -
 16
16 -
 17
17 -
 18
18 -
 19
19 -
 20
20 -
 21
21 -
 22
22 -
 23
23 -
 24
24 -
 25
25 -
26
-
27
-
28
-
29
-
30
-
31
-
32
-
33
-
34
-
35
-
36
-
37
-
38
-
39
-
40
-
41
-
42
-
43
-
44
-
45
-
46
-
47
-
48
-
49
-
50
-
51
-
52
-
53
-
54
-
55
-
56
-
57
-
58
-
59
-
60
-
61
-
62
-
63
-
64
-
65
-
66
-
67
-
68
-
69
-
70
-
71
-
72
-
73
-
74
-
75
-
76
-
77
-
78
-
79
-
80
-
81
-
82
-
83
-
84
-
85
-
86
-
87
-
88
-
89
-
90
-
91
-
92
-
93
-
94
-
95
-
96
-
97
-
98
-
99
-
100
-
101
-
102
-
103
-
104
-
105
-
106
-
107
-
108
-
109
-
110
-
111
-
112
-
113
-
114
-
115
-
116
-
117
-
118
-
119
-
120
-
121
-
122
-
123
-
124
-
125
-
126
-
127
-
128
-
129
-
130
-
131
-
132
-
133
-
134
-
135
-
136
-
137
-
138
-
139
-
140
-
141
-
142
-
143
-
144
-
145
-
146
-
147
-
148
-
149
-
150
-
151
-
152
-
153
-
154
-
155
-
156
-
157
-
158
-
159
-
160
-
161
-
162
-
163
-
164
-
165
-
166
-
167
-
168
-
169
-
170
-
171
-
172
-
173
-
174
-
175
-
176
-
177
-
178
-
179
-
180
-
181
-
182
-
183
-
184
-
185
-
186
-
187
-
188
-
189
-
190
-
191
-
192
-
193
-
194
-
195
-
196
-
197
-
198
-
199
-
200
-
201
-
202
-
203
-
204
-
205
-
206
-
207
-
208
-
209
-
210
-
211
-
212
-
213
-
214
-
215
-
216
-
217
-
218
-
219
-
220
-
221
-
222
-
223
-
224
-
225
-
226
-
227
-
228
-
229
-
230
-
231
-
232
-
233
-
234
-
235
-
236
-
237
-
238
-
239
-
240
-
241
-
242
-
243
-
244
-
245
-
246
-
247
-
248
-
249
-
250
-
251
-
252
-
253
-
254
-
255
-
256
-
257
-
258
-
259
-
260
-
261
-
262
-
263
-
264
-
265
-
266
-
267
-
268
-
269
-
270
-
271
-
272
-
273
-
274
-
275
-
276
-
277
-
278
-
279
-
280
-
281
-
282
-
283
-
284
-
285
-
286
-
287
-
288
-
289
-
290
-
291
-
292
-
293
-
294
-
295
-
296
-
297
-
298
-
299
-
300
-
301
-
302
-
303
-
304
-
305
-
306
-
307
-
308
-
309
-
310
-
311
-
312
-
313
-
314
-
315
-
316
-
317
-
318
-
319
-
320
 |
 |

changes is pervasive throughout these
results. At Group level, whilst individual line
items may have been significantly affected,
we believe the application of IAS 32, IAS 39
and IFRS 4 has not had a material impact on
attributable profits or earnings per share but
has significantly increased balance sheet
footings. We have previously reported in
detail on the line items which would be
affected by IFRS and the outcomes have been
consistent with our earlier expectations.
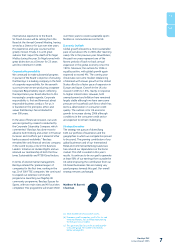
Capital strength
Our strong credit rating and disciplined
approach to capital management remain
sources of competitive advantage.
Our capital management policies are
designed to optimise the returns to
shareholders whilst maintaining our rating.
At the end of 2005, our tier 1 capital ratio
was 7.0% and our risk asset ratio was 11.3%.
Over the past two years we have consciously
sought to address the extent to which we
are carrying surplus capital and to use our
resources more intensively. In 2004, we
bought back approximately £700m in shares
and we have changed the mix of our core
capital in both 2004 and 2005 by introducing
preference shares into the capital base.
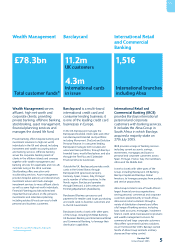
In 2005, we acquired Absa Group Limited
without issuing ordinary equity, made a
number of other smaller acquisitions,
increased weighted risk assets 10%
excluding Absa and paid dividends of £1.6bn.
Despite this we ended the year with a tier 1
ratio only marginally changed from the level
post the impact of IFRS at the beginning of
the year. This resulted from the strong cash
flow generation of our business portfolio and
the efficient management of the balance
sheet through the use of the capital markets.
(a) Economic profit is defined on page 7.
(b) Total income net of insurance claims.
(c) Profit before tax.
(d) Operating expenses compared to total
income net of insurance claims.
(e) Absa has changed its financial year end to
31st December to conform with Barclays.
The comparable period comprises unaudited
results for the nine months ended
31st December 2004.
(f) Does not reflect the application of IAS 32,
IAS 39 and IFRS 4 which became effective
from 1st January 2005. Further explanation
is provided on page 134.
Barclays PLC
Annual Report 2005 13
1.4
During 2006 we expect continued strong
growth in capital investment in our
businesses to support organic growth and for
our tier 1 capital ratio to move towards our
target of 7.25% through the combination of
the impact of retained earnings and
continued efficient use of the capital markets.
Outlook
We expect the UK economy to show
reasonable growth in 2006, but the credit
environment in the consumer sector is likely
to remain challenging. Impairment charges
in the UK small and medium business sector
have been exceptionally low in the recent
past and may trend towards more normal
levels in 2006. The healthy global economy
should provide a positive backdrop for all our
businesses this year. We start 2006 with
strong income momentum throughout
Barclays and this positions us well for
another year of good earnings growth.
Naguib Kheraj
Group Finance Director
”