Barclays 2005 Annual Report Download - page 13
Download and view the complete annual report
Please find page 13 of the 2005 Barclays annual report below. You can navigate through the pages in the report by either clicking on the pages listed below, or by using the keyword search tool below to find specific information within the annual report.-
 1
1 -
2
-
 3
3 -
 4
4 -
 5
5 -
 6
6 -
 7
7 -
 8
8 -
 9
9 -
 10
10 -
 11
11 -
 12
12 -
 13
13 -
 14
14 -
 15
15 -
 16
16 -
 17
17 -
 18
18 -
 19
19 -
 20
20 -
 21
21 -
 22
22 -
 23
23 -
24
-
25
-
26
-
27
-
28
-
29
-
30
-
31
-
32
-
33
-
34
-
35
-
36
-
37
-
38
-
39
-
40
-
41
-
42
-
43
-
44
-
45
-
46
-
47
-
48
-
49
-
50
-
51
-
52
-
53
-
54
-
55
-
56
-
57
-
58
-
59
-
60
-
61
-
62
-
63
-
64
-
65
-
66
-
67
-
68
-
69
-
70
-
71
-
72
-
73
-
74
-
75
-
76
-
77
-
78
-
79
-
80
-
81
-
82
-
83
-
84
-
85
-
86
-
87
-
88
-
89
-
90
-
91
-
92
-
93
-
94
-
95
-
96
-
97
-
98
-
99
-
100
-
101
-
102
-
103
-
104
-
105
-
106
-
107
-
108
-
109
-
110
-
111
-
112
-
113
-
114
-
115
-
116
-
117
-
118
-
119
-
120
-
121
-
122
-
123
-
124
-
125
-
126
-
127
-
128
-
129
-
130
-
131
-
132
-
133
-
134
-
135
-
136
-
137
-
138
-
139
-
140
-
141
-
142
-
143
-
144
-
145
-
146
-
147
-
148
-
149
-
150
-
151
-
152
-
153
-
154
-
155
-
156
-
157
-
158
-
159
-
160
-
161
-
162
-
163
-
164
-
165
-
166
-
167
-
168
-
169
-
170
-
171
-
172
-
173
-
174
-
175
-
176
-
177
-
178
-
179
-
180
-
181
-
182
-
183
-
184
-
185
-
186
-
187
-
188
-
189
-
190
-
191
-
192
-
193
-
194
-
195
-
196
-
197
-
198
-
199
-
200
-
201
-
202
-
203
-
204
-
205
-
206
-
207
-
208
-
209
-
210
-
211
-
212
-
213
-
214
-
215
-
216
-
217
-
218
-
219
-
220
-
221
-
222
-
223
-
224
-
225
-
226
-
227
-
228
-
229
-
230
-
231
-
232
-
233
-
234
-
235
-
236
-
237
-
238
-
239
-
240
-
241
-
242
-
243
-
244
-
245
-
246
-
247
-
248
-
249
-
250
-
251
-
252
-
253
-
254
-
255
-
256
-
257
-
258
-
259
-
260
-
261
-
262
-
263
-
264
-
265
-
266
-
267
-
268
-
269
-
270
-
271
-
272
-
273
-
274
-
275
-
276
-
277
-
278
-
279
-
280
-
281
-
282
-
283
-
284
-
285
-
286
-
287
-
288
-
289
-
290
-
291
-
292
-
293
-
294
-
295
-
296
-
297
-
298
-
299
-
300
-
301
-
302
-
303
-
304
-
305
-
306
-
307
-
308
-
309
-
310
-
311
-
312
-
313
-
314
-
315
-
316
-
317
-
318
-
319
-
320
 |
 |

Barclays PLC
Annual Report 2005 11
Group Finance Director’s review
1.3
Business performance
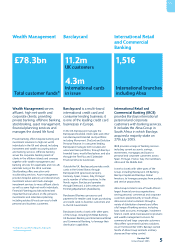
UK Banking produced good profit growth(c),
up 8%, to £2,455m (2004: £2,265m) and
outperformed its productivity target for 2005
with the cost:income(d) ratio improving by
three percentage points.
UK Retail Banking achieved solid income(b)
growth of 4% in 2005, with a marked pick-
up in the second half of the year which we
believe establishes good momentum for
2006. Operating expenses decreased 3%
through strong cost control whilst continuing
targeted reinvestment to improve customer
service and the branch network. Profit before
tax grew 7% to £1,027m (2004: £963m).
Excluding the gain on the sale of our stake in
Edotech in 2004, underlying profit before tax
increased 12%.
UK Business Banking profit before tax
increased 10% to £1,428m (2004: £1,302m),
driven by strong income and balance sheet
growth. Operating expenses grew slower
than income leading to an improved
cost:income(d) ratio of 35%.
Barclays Capital continued its very strong
growth of recent years, with profit before
tax in 2005 rising 25% to £1,272m (2004:
£1,020m). Income growth of 27% was
broadly based across products and
geographies. The year also saw continued
investment in building Barclays Capital’s scale
and diversity in terms of geography, products
and people. As a result of investment and the
profit performance, operating expenses grew
28%. Market risk was well-controlled with
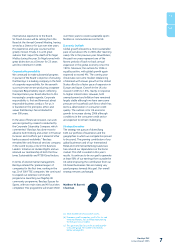
“Group performance
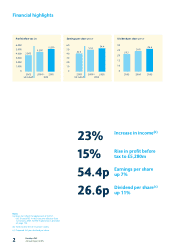
Barclays delivered strong financial results
in 2005. Profit before tax was £5,280m, an
increase of 15% from 2004. Earnings per
share rose 7%, and economic profit(a) was
up 12%. Return on average shareholders’
equity was 21% and we have increased the
total dividend payout 11%.
Income(b) rose 23%, an increase which was
broadly spread across the Group with most
businesses reporting double digit income
growth and UK Retail Banking returning to
modest top line growth.
Operating expenses grew in line with
income, reflecting significant investment
directed to the global businesses, higher
performance related expenses, the
expansion of International Retail and
Commercial Banking and head office
relocation. Excluding the first time
contribution of Absa, income and
operating expenses increased 16%.
Impairment charges increased 44% to
£1,571m (2004: £1,093m). This reflected
some large one-off releases and recoveries in
2004, the impact of acquisitions in 2005 and
changes in methodology. Excluding these
factors, the rate of growth in impairment
charges was 24%, driven by a continued
increase in arrears balances and lower rates
of recovery from customers in UK credit
cards. Impairment charges rose at a slower
rate in unsecured loans and were minimal
in UK mortgages. Wholesale and corporate
credit conditions were stable.
Naguib Kheraj
Group Finance Director
15%
increase in
profit before tax
2003
UK GAAP IFRS
0
1,000
2,000
3,000
6,000
5,000
4,000
Profit before tax £m
3,845
2004(f)
4,580
2005
5,280