Barclays 2005 Annual Report Download - page 14
Download and view the complete annual report
Please find page 14 of the 2005 Barclays annual report below. You can navigate through the pages in the report by either clicking on the pages listed below, or by using the keyword search tool below to find specific information within the annual report.-
 1
1 -
2
-
3
-
 4
4 -
 5
5 -
 6
6 -
 7
7 -
 8
8 -
 9
9 -
 10
10 -
 11
11 -
 12
12 -
 13
13 -
 14
14 -
 15
15 -
 16
16 -
 17
17 -
 18
18 -
 19
19 -
 20
20 -
 21
21 -
 22
22 -
 23
23 -
 24
24 -
25
-
26
-
27
-
28
-
29
-
30
-
31
-
32
-
33
-
34
-
35
-
36
-
37
-
38
-
39
-
40
-
41
-
42
-
43
-
44
-
45
-
46
-
47
-
48
-
49
-
50
-
51
-
52
-
53
-
54
-
55
-
56
-
57
-
58
-
59
-
60
-
61
-
62
-
63
-
64
-
65
-
66
-
67
-
68
-
69
-
70
-
71
-
72
-
73
-
74
-
75
-
76
-
77
-
78
-
79
-
80
-
81
-
82
-
83
-
84
-
85
-
86
-
87
-
88
-
89
-
90
-
91
-
92
-
93
-
94
-
95
-
96
-
97
-
98
-
99
-
100
-
101
-
102
-
103
-
104
-
105
-
106
-
107
-
108
-
109
-
110
-
111
-
112
-
113
-
114
-
115
-
116
-
117
-
118
-
119
-
120
-
121
-
122
-
123
-
124
-
125
-
126
-
127
-
128
-
129
-
130
-
131
-
132
-
133
-
134
-
135
-
136
-
137
-
138
-
139
-
140
-
141
-
142
-
143
-
144
-
145
-
146
-
147
-
148
-
149
-
150
-
151
-
152
-
153
-
154
-
155
-
156
-
157
-
158
-
159
-
160
-
161
-
162
-
163
-
164
-
165
-
166
-
167
-
168
-
169
-
170
-
171
-
172
-
173
-
174
-
175
-
176
-
177
-
178
-
179
-
180
-
181
-
182
-
183
-
184
-
185
-
186
-
187
-
188
-
189
-
190
-
191
-
192
-
193
-
194
-
195
-
196
-
197
-
198
-
199
-
200
-
201
-
202
-
203
-
204
-
205
-
206
-
207
-
208
-
209
-
210
-
211
-
212
-
213
-
214
-
215
-
216
-
217
-
218
-
219
-
220
-
221
-
222
-
223
-
224
-
225
-
226
-
227
-
228
-
229
-
230
-
231
-
232
-
233
-
234
-
235
-
236
-
237
-
238
-
239
-
240
-
241
-
242
-
243
-
244
-
245
-
246
-
247
-
248
-
249
-
250
-
251
-
252
-
253
-
254
-
255
-
256
-
257
-
258
-
259
-
260
-
261
-
262
-
263
-
264
-
265
-
266
-
267
-
268
-
269
-
270
-
271
-
272
-
273
-
274
-
275
-
276
-
277
-
278
-
279
-
280
-
281
-
282
-
283
-
284
-
285
-
286
-
287
-
288
-
289
-
290
-
291
-
292
-
293
-
294
-
295
-
296
-
297
-
298
-
299
-
300
-
301
-
302
-
303
-
304
-
305
-
306
-
307
-
308
-
309
-
310
-
311
-
312
-
313
-
314
-
315
-
316
-
317
-
318
-
319
-
320
 |
 |

DVaR falling 6% to £32m as a result of
increased diversification. The rate of growth
of earnings once again exceeded the rate of
growth of capital consumption.
Barclays Global Investors achieved
outstanding results, with profit before
tax rising 61% to £542m (2004: £336m),
reflecting strong growth in net new assets,
very good investment performance and a
continuing improvement in operating
margins. Income growth of 48% was driven
by significant increases in management fees,
incentive fees, and securities lending
revenues. Operating expenses rose 40%,
reflecting higher performance-based
compensation and significant investment in
the platform and in innovative new products.
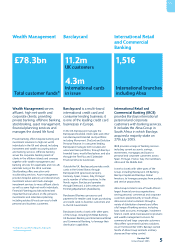
Wealth Management profit before tax rose
56% to £172m (2004: £110m) – a very
strong performance driven by broad-based
income growth of 11% and improved cost
efficiency. Operating expenses grew only 3%
as efficiency savings funded significant cost
restructuring and investment programmes.
Barclaycard profit before tax fell 19% to
£687m (2004: £843m) driven by higher
levels of impairment in the UK and continued
investment in the International business.
Income(b) growth of 15% reflected good
performances by the UK cards and loans
businesses and very strong international
growth. Operating expenses rose 21%,
reflecting continued heavy investment in
the business, particularly internationally. The
Barclaycard US business, previously Juniper,
grew strongly in line with plans, and cards in
Spain and Germany performed strongly.
International Retail and Commercial
Banking was transformed by the acquisition
of Absa. International Retail and
Commercial Banking excluding Absa
increased profit before tax 21% to £355m
(2004: £293m). Income(b) growth of 20%
reflected strong balance sheet growth in
Europe and Africa. Operating expenses
grew in line with income(b) as we accelerated
the integration of Banco Zaragozano.
Excluding integration costs, Barclays Spain
increased profit before tax 25% to £156m
(2004: £125m).
We completed the acquisition of a majority
stake in Absa Group Limited in July 2005.
Absa Group Limited reported 28% growth
in profit before tax to R7,031m for the nine-
month period to 31st December 2005(e).For
the five-month period of Barclays ownership,
Absa contributed £335m to profit before tax
and the performance of Absa is well ahead
of the business plan that underpinned the
acquisition.
Head office functions and other operations
loss before tax increased to £532m (2004:
£235m). This was driven by accounting
adjustments to eliminate inter-segment
transactions of £204m (2004: £69m) and
non-recurring costs of £165m (2004: £32m)
including the costs of head office relocation
and write-off of capitalised IT related assets.
International Financial Reporting
Standards
Barclays applied International Financial
Reporting Standards (IFRS) with effect from
1st January 2004, with the exception of IAS
32, IAS 39 and IFRS 4, which were applied
from 1st January 2005. The effect of these
Barclays PLC
Annual Report 2005
12
Group Finance Director’s review continued
0
20
10
30
40
50
60
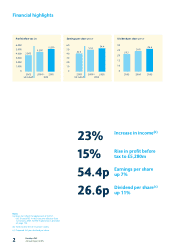
Earnings per share pence
42.3
2004(f)
51.0
2005
54.4
2003
UK GAAP IFRS
0
10
15
20
30
25
Dividend per share pence
20.5
2004
24.0
2005
26.6
2003