BT 2011 Annual Report Download - page 9
Download and view the complete annual report
Please find page 9 of the 2011 BT annual report below. You can navigate through the pages in the report by either clicking on the pages listed below, or by using the keyword search tool below to find specific information within the annual report.-
 1
1 -
 2
2 -
 3
3 -
 4
4 -
 5
5 -
 6
6 -
 7
7 -
 8
8 -
 9
9 -
 10
10 -
 11
11 -
 12
12 -
 13
13 -
 14
14 -
 15
15 -
 16
16 -
 17
17 -
 18
18 -
 19
19 -
 20
20 -
21
-
22
-
23
-
24
-
25
-
26
-
27
-
28
-
29
-
30
-
31
-
32
-
33
-
34
-
35
-
36
-
37
-
38
-
39
-
40
-
41
-
42
-
43
-
44
-
45
-
46
-
47
-
48
-
49
-
50
-
51
-
52
-
53
-
54
-
55
-
56
-
57
-
58
-
59
-
60
-
61
-
62
-
63
-
64
-
65
-
66
-
67
-
68
-
69
-
70
-
71
-
72
-
73
-
74
-
75
-
76
-
77
-
78
-
79
-
80
-
81
-
82
-
83
-
84
-
85
-
86
-
87
-
88
-
89
-
90
-
91
-
92
-
93
-
94
-
95
-
96
-
97
-
98
-
99
-
100
-
101
-
102
-
103
-
104
-
105
-
106
-
107
-
108
-
109
-
110
-
111
-
112
-
113
-
114
-
115
-
116
-
117
-
118
-
119
-
120
-
121
-
122
-
123
-
124
-
125
-
126
-
127
-
128
-
129
-
130
-
131
-
132
-
133
-
134
-
135
-
136
-
137
-
138
-
139
-
140
-
141
-
142
-
143
-
144
-
145
-
146
-
147
-
148
-
149
-
150
-
151
-
152
-
153
-
154
-
155
-
156
-
157
-
158
-
159
-
160
-
161
-
162
-
163
-
164
-
165
-
166
-
167
-
168
-
169
-
170
-
171
-
172
-
173
-
174
-
175
-
176
-
177
-
178
-
179
-
180
-
181
-
182
-
183
-
184
-
185
-
186
-
187
-
188
-
189
 |
 |

OVERVIEW
6
OUR STRATEGY
•Driving broadband-based consumer services
•Being the ‘Brand for Business’ for UK SMEs
•BT Global Services – a global leader
•The wholesaler of choice
•The best network provider
•A responsible and sustainable business leader
Our aim is to drive shareholder value by making BT a better business with a better future.
Our strategy starts with
customer service. Our
goal is to deliver excellent
customer service as it is
vital for our customers
and reduces our costs
when we get things
‘right first time’.
> More on page 10
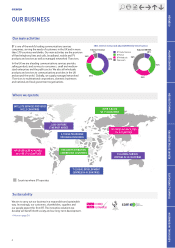
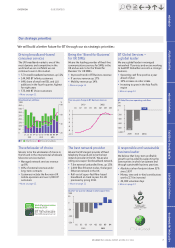
We measure our overall progress by three key performance indicators:
Adjusted earnings per share
This is a measure of the overall
profitability of our business.
> More on page 49
Reported free cash flow
This is a measure of the cash generated
by our business that is available to invest
in the business, reduce net debt, support
the pension fund and pay dividends.
> More on page 50
Customer service improvement
This is a measure of the level of
improvement in how we are serving our
customers.
> More on page 10
Our aim
Key performance indicators
0
5
10
15
20
25
Adjusted earnings per sharea
pence
2011
21.0
2010
17.3
2009
14.1
2008
20.2
2007
19.1
0
2,500
2,000
1,500
1,000
500
201120102008 20092007
1,874 1,823
737
1,933 2,011
Reported free cash flowb
£m
0
45
40
35
30
25
15
5
20
10
201120102008 2009
9.0%
17.0%
10.5%
3.0%
Customer service improvementc
%
CUSTOMER
SERVICE DELIVERY
COST
TRANSFORMATION
A BETTER
BUSINESS
A BETTER
FUTURE
INVESTING FOR
THE FUTURE
aAdjusted earnings per share is stated before specific items. See page 57 for further details.
bReported free cash flow is a non-GAAP measure. See page 58 for further details.
cCumulative improvement from 1 April 2007.
Improved customer
service and reduced cost
of failure along with other
efficiency measures drive
lower costs across our
business.
> More on page 11
Cost transformation frees
up financial and other
resources to allow us to
invest in our networks,
systems, and products
and services to drive
growth.
> More on page 11
OVERVIEWBUSINESS REVIEWFINANCIAL REVIEWREPORT OF THE DIRECTORSFINANCIAL STATEMENTSADDITIONAL INFORMATION