BT 2011 Annual Report Download - page 5
Download and view the complete annual report
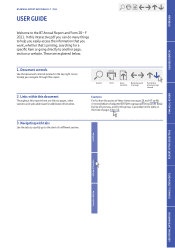
Please find page 5 of the 2011 BT annual report below. You can navigate through the pages in the report by either clicking on the pages listed below, or by using the keyword search tool below to find specific information within the annual report.-
 1
1 -
 2
2 -
 3
3 -
 4
4 -
 5
5 -
 6
6 -
 7
7 -
 8
8 -
 9
9 -
 10
10 -
 11
11 -
 12
12 -
 13
13 -
 14
14 -
 15
15 -
 16
16 -
17
-
18
-
19
-
20
-
21
-
22
-
23
-
24
-
25
-
26
-
27
-
28
-
29
-
30
-
31
-
32
-
33
-
34
-
35
-
36
-
37
-
38
-
39
-
40
-
41
-
42
-
43
-
44
-
45
-
46
-
47
-
48
-
49
-
50
-
51
-
52
-
53
-
54
-
55
-
56
-
57
-
58
-
59
-
60
-
61
-
62
-
63
-
64
-
65
-
66
-
67
-
68
-
69
-
70
-
71
-
72
-
73
-
74
-
75
-
76
-
77
-
78
-
79
-
80
-
81
-
82
-
83
-
84
-
85
-
86
-
87
-
88
-
89
-
90
-
91
-
92
-
93
-
94
-
95
-
96
-
97
-
98
-
99
-
100
-
101
-
102
-
103
-
104
-
105
-
106
-
107
-
108
-
109
-
110
-
111
-
112
-
113
-
114
-
115
-
116
-
117
-
118
-
119
-
120
-
121
-
122
-
123
-
124
-
125
-
126
-
127
-
128
-
129
-
130
-
131
-
132
-
133
-
134
-
135
-
136
-
137
-
138
-
139
-
140
-
141
-
142
-
143
-
144
-
145
-
146
-
147
-
148
-
149
-
150
-
151
-
152
-
153
-
154
-
155
-
156
-
157
-
158
-
159
-
160
-
161
-
162
-
163
-
164
-
165
-
166
-
167
-
168
-
169
-
170
-
171
-
172
-
173
-
174
-
175
-
176
-
177
-
178
-
179
-
180
-
181
-
182
-
183
-
184
-
185
-
186
-
187
-
188
-
189
 |
 |

OVERVIEW
2
FINANCIAL SUMMARY
Group results
How we performed in 2011 Outlook
Outlook
May 2010 Result
Revenue c.£20bn £20.1bn
Operating costdsavings c.£900m £1.1bn
Adjusted EBITDAa,c in line with 2010f£5.9bn
Adjusted free cash flowc,e c.£1.8bnf£2.2bn
Net debtc<£9bn £8.8bn
We expect
•Underlying revenuegexcluding transit to be in the
range of down 2% to flat in 2012 and to grow by up
to 2% in 2013
•Adjusted EBITDA to grow in 2012 and to be above
£6.0bn in 2013
•Adjusted free cash flow to be above the 2011 level in
both 2012 and 2013
aItems presented as adjusted are stated before specific items. See page 56 for further details.
bEBITDA: Earnings before interest, taxation, depreciation and amortisation.
cAdjusted and reported EBITDA, adjusted and reported free cash flow and net debt are non-GAAP
measures provided in addition to the disclosure requirements of IFRS. See page 56 for further details.
dOperating costs before specific items, depreciation and amortisation. See page 48 for further details.
2011 2010 Change
Revenue
adjusteda£20,076m £20,911m 4%
reported £20,076m £20,859m 4%
EBITDAb,c
adjusteda£5,886m £5,639m 4%
reported £5,557m £5,162m 8%
Profit before taxation
adjusteda£2,083m £1,735m 20%
reported £1,717m £1,007m 71%
Earnings per share
adjusteda21.0p 17.3p 21%
reported 19.4p 13.3p 46%
Proposed full year dividend
7.4p 6.9p 7%
Free cash flowc,e
adjusteda£2,223m £2,106m £117m
reported £2,011m £1,933m £78m
Net debtc
£8,816m £9,283m £467m
eBefore pension deficit payments.
fAdjusted EBITDA and adjusted free cash flow outlook updated in November 2010 to be around
£5.8bn and £2bn, respectively.
gUnderlying revenue excludes the impact of foreign exchange movements, acquisitions and disposals
and specific items.
OVERVIEWBUSINESS REVIEWFINANCIAL REVIEWREPORT OF THE DIRECTORSFINANCIAL STATEMENTSADDITIONAL INFORMATION