BP 2015 Annual Report Download - page 85
Download and view the complete annual report
Please find page 85 of the 2015 BP annual report below. You can navigate through the pages in the report by either clicking on the pages listed below, or by using the keyword search tool below to find specific information within the annual report.-
 1
1 -
2
-
3
-
4
-
5
-
6
-
7
-
8
-
9
-
10
-
11
-
12
-
13
-
14
-
15
-
16
-
17
-
18
-
19
-
20
-
21
-
22
-
23
-
24
-
25
-
26
-
27
-
28
-
29
-
30
-
31
-
32
-
33
-
34
-
35
-
36
-
37
-
38
-
39
-
40
-
41
-
42
-
43
-
44
-
45
-
46
-
47
-
48
-
49
-
50
-
51
-
52
-
53
-
54
-
55
-
56
-
57
-
58
-
59
-
60
-
61
-
62
-
63
-
64
-
65
-
66
-
67
-
68
-
69
-
70
-
71
-
72
-
73
-
74
-
 75
75 -
 76
76 -
 77
77 -
 78
78 -
 79
79 -
 80
80 -
 81
81 -
 82
82 -
 83
83 -
 84
84 -
 85
85 -
 86
86 -
 87
87 -
 88
88 -
 89
89 -
 90
90 -
 91
91 -
 92
92 -
 93
93 -
 94
94 -
 95
95 -
96
-
97
-
98
-
99
-
100
-
101
-
102
-
103
-
104
-
105
-
106
-
107
-
108
-
109
-
110
-
111
-
112
-
113
-
114
-
115
-
116
-
117
-
118
-
119
-
120
-
121
-
122
-
123
-
124
-
125
-
126
-
127
-
128
-
129
-
130
-
131
-
132
-
133
-
134
-
135
-
136
-
137
-
138
-
139
-
140
-
141
-
142
-
143
-
144
-
145
-
146
-
147
-
148
-
149
-
150
-
151
-
152
-
153
-
154
-
155
-
156
-
157
-
158
-
159
-
160
-
161
-
162
-
163
-
164
-
165
-
166
-
167
-
168
-
169
-
170
-
171
-
172
-
173
-
174
-
175
-
176
-
177
-
178
-
179
-
180
-
181
-
182
-
183
-
184
-
185
-
186
-
187
-
188
-
189
-
190
-
191
-
192
-
193
-
194
-
195
-
196
-
197
-
198
-
199
-
200
-
201
-
202
-
203
-
204
-
205
-
206
-
207
-
208
-
209
-
210
-
211
-
212
-
213
-
214
-
215
-
216
-
217
-
218
-
219
-
220
-
221
-
222
-
223
-
224
-
225
-
226
-
227
-
228
-
229
-
230
-
231
-
232
-
233
-
234
-
235
-
236
-
237
-
238
-
239
-
240
-
241
-
242
-
243
-
244
-
245
-
246
-
247
-
248
-
249
-
250
-
251
-
252
-
253
-
254
-
255
-
256
-
257
-
258
-
259
-
260
-
261
-
262
-
263
-
264
-
265
-
266
 |
 |

Corporate governance
Strategic imperatives represented the final third. These included relative
RRR, S&OR, and major project delivery, each weighted equally.
Preliminary assessment of BP’s relative RRR indicated a positive outcome
with an expected first place amongst the comparator group. The final
ranking will be determined once the actual results for 2015 have been
published by other comparator companies. For the purposes of this report,
and in accordance with the UK regulations, first place has been assumed.
Any adjustment to this will be reported in next year’s annual report on
remuneration. Based on a provisional first place assessment, 11.1% of the
overall shares for this measure are expected to vest.
S&OR has improved significantly over the 2013-15 period, with a
downward trend over the period in tier 1 process safety events (53%),
recordable injury frequency (30%), and loss of primary containment (28%).
The operating management system continued to mature and there has
been a continual rise in assessed conformance levels. Consequently
10.4% of overall shares will vest for the safety measures.
Fifteen major projects were delivered over the three years – well ahead of
plan and resulting in full vesting for this measure. As a result, 11.1% of
overall shares will vest.
As in past years, the committee also considered the true underlying
operational and financial performance of the group during the period and
whether any other factors should be taken into account. Following this
review, the committee assessed that a preliminary 77.6% vesting was a
fair reflection of the overall performance, pending confirmation of the
relative reserves replacement ratio result. This will result in the vesting
shown in the table below.
The vested shares for current executive directors are subject to a further
three-year retention period before they will be released to the individuals in
2019.
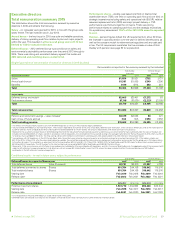
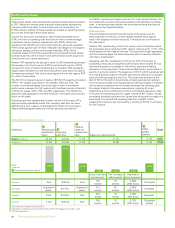
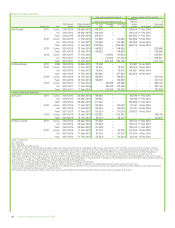
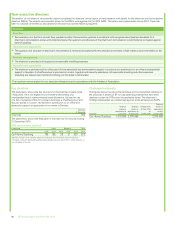
2013-2015 performance shares preliminary outcome
Shares
awarded
Shares vested
including dividends
Value of
vested shares
Bob Dudley 1,384,026 1,262,868 $7,116,261
Dr Brian Gilvary 637,413 597,628 £2,223,176
2012-2014 final outcomes confirmation
Last year it was reported that the committee had made a preliminary
assessment of second place for the relative RRR in the 2012-2014
performance shares element. In May 2015 the committee reviewed the
results for all comparator companies as published in their reports and
accounts and assessed that BP was in first place relative to other oil majors
and that the full 11.1% of shares would vest for this performance measure
as opposed to 7.8% for second place. This resulted in a final overall vesting
of 63.8% (versus 60.5% as preliminarily outlined in the 2014 report) for the
entire award. This change is reflected in the single figure table on page 77.
2016 implementation
Consistent with application of policy and our previous approach, shares are
expected to be awarded in March 2016 to the maximum value allowed
under the policy, five-and-a-half-times salary for Bob Dudley and four-times
salary for Dr Brian Gilvary. These will be awarded under the performance
share element of the EDIP and will be subject to a three-year performance
period. Those shares that vest are subject, after tax, to an additional
three-year retention period. The 2016-2018 performance share element
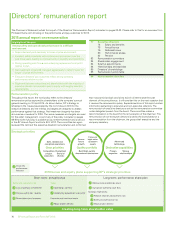
will be assessed over three years based on the following measures:
relative TSR (one third); cumulative operating cash flow (one third); and
strategic imperatives (one third) including relative RRR; S∨ and major
project delivery, all equally weighted.
These measures continue to be aligned with BP’s strategic priorities of
safe, reliable and compliant operations, competitive project execution,
disciplined financial choices and sources of future growth. The committee
agreed targets and scales for measures that will be used to assess
performance at the end of the three-year performance period and these
will be disclosed retrospectively, to the extent that they are no longer
commercially sensitive.
For S&OR the committee will study annual results based on outcomes
from the annual cash bonus for the period 2016 to 2018 and make a
determination of the three-year outcome. Similarly for operating cash flow
the committee, at the end of the period, will make a determination of the
three-year outcome by comparing the cumulative actual annual results
against the cumulative actual annual targets.
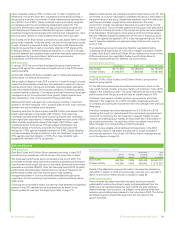
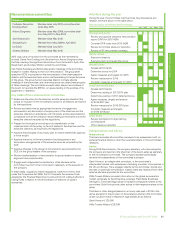
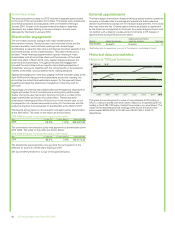
TSR and RRR will be assessed on a relative basis compared with the other
oil majors Chevron, ExxonMobil, Shell and Total with the following vesting
schedule.
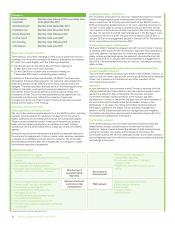
Relative performance ranking
BP’s ranking place versus oil majors
Vesting percentage for each
relative performance measure
First 100%
Second 80%
Third 25%
Fourth or fifth Nil
BP Annual Report and Form 20-F 2015 81