BP 2015 Annual Report Download - page 224
Download and view the complete annual report
Please find page 224 of the 2015 BP annual report below. You can navigate through the pages in the report by either clicking on the pages listed below, or by using the keyword search tool below to find specific information within the annual report.-
 1
1 -
2
-
3
-
4
-
5
-
6
-
7
-
8
-
9
-
10
-
11
-
12
-
13
-
14
-
15
-
16
-
17
-
18
-
19
-
20
-
21
-
22
-
23
-
24
-
25
-
26
-
27
-
28
-
29
-
30
-
31
-
32
-
33
-
34
-
35
-
36
-
37
-
38
-
39
-
40
-
41
-
42
-
43
-
44
-
45
-
46
-
47
-
48
-
49
-
50
-
51
-
52
-
53
-
54
-
55
-
56
-
57
-
58
-
59
-
60
-
61
-
62
-
63
-
64
-
65
-
66
-
67
-
68
-
69
-
70
-
71
-
72
-
73
-
74
-
75
-
76
-
77
-
78
-
79
-
80
-
81
-
82
-
83
-
84
-
85
-
86
-
87
-
88
-
89
-
90
-
91
-
92
-
93
-
94
-
95
-
96
-
97
-
98
-
99
-
100
-
101
-
102
-
103
-
104
-
105
-
106
-
107
-
108
-
109
-
110
-
111
-
112
-
113
-
114
-
115
-
116
-
117
-
118
-
119
-
120
-
121
-
122
-
123
-
124
-
125
-
126
-
127
-
128
-
129
-
130
-
131
-
132
-
133
-
134
-
135
-
136
-
137
-
138
-
139
-
140
-
141
-
142
-
143
-
144
-
145
-
146
-
147
-
148
-
149
-
150
-
151
-
152
-
153
-
154
-
155
-
156
-
157
-
158
-
159
-
160
-
161
-
162
-
163
-
164
-
165
-
166
-
167
-
168
-
169
-
170
-
171
-
172
-
173
-
174
-
175
-
176
-
177
-
178
-
179
-
180
-
181
-
182
-
183
-
184
-
185
-
186
-
187
-
188
-
189
-
190
-
191
-
192
-
193
-
194
-
195
-
196
-
197
-
198
-
199
-
200
-
201
-
202
-
203
-
204
-
205
-
206
-
207
-
208
-
209
-
210
-
211
-
212
-
213
-
 214
214 -
 215
215 -
 216
216 -
 217
217 -
 218
218 -
 219
219 -
 220
220 -
 221
221 -
 222
222 -
 223
223 -
 224
224 -
 225
225 -
 226
226 -
 227
227 -
 228
228 -
 229
229 -
 230
230 -
 231
231 -
 232
232 -
 233
233 -
 234
234 -
235
-
236
-
237
-
238
-
239
-
240
-
241
-
242
-
243
-
244
-
245
-
246
-
247
-
248
-
249
-
250
-
251
-
252
-
253
-
254
-
255
-
256
-
257
-
258
-
259
-
260
-
261
-
262
-
263
-
264
-
265
-
266
 |
 |

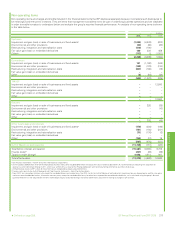
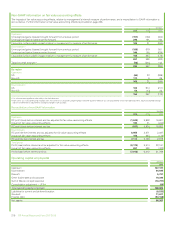
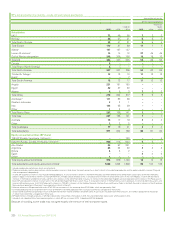
Contractual obligations
The following table summarizes the group’s capital expenditure commitments for property, plant and equipment at 31 December 2015 and the
proportion of that expenditure for which contracts have been placed.
$ million
Payments due by period
Capital expenditure Total 2016 2017 2018 2019 2020
2021 and
thereafter
Committed 36,972 15,408 8,009 7,248 4,490 855 962
of which is contracted 10,379 6,224 2,031 1,317 645 75 87
Capital expenditure is considered to be committed when the project has received the appropriate level of internal management approval. For joint
operations*, the net BP share is included in the amounts above.
In addition, at 31 December 2015, the group had committed to capital expenditure relating to investments in equity-accounted entities amounting to
$4,229 million. Contracts were in place for $2,933 million of this total.
The following table summarizes the group’s principal contractual obligations at 31 December 2015, distinguishing between those for which a liability is
recognized on the balance sheet and those for which no liability is recognized. Further information on borrowings is given in Financial statements –
Note 25 and more information on operating leases is given in Financial statements – Note 27.
$ million
Payments due by period
Expected payments by period under contractual obligations Total 2016 2017 2018 2019 2020
2021 and
thereafter
Balance sheet obligations
Borrowingsa56,692 7,764 6,502 6,815 6,600 6,741 22,270
Finance lease future minimum lease paymentsb1,460 108 106 97 95 91 963
Decommissioning liabilitiesc21,762 796 600 596 383 643 18,744
Environmental liabilitiesc10,012 586 822 480 669 664 6,791
Pensions and other post-retirement benefitsd23,399 1,656 1,805 1,791 1,785 1,278 15,084
113,325 10,910 9,835 9,779 9,532 9,417 63,852
Off-balance sheet obligations
Operating lease future minimum lease paymentse15,422 4,144 2,904 1,933 1,615 1,291 3,535
Unconditional purchase obligationsf120,286 47,859 12,489 8,743 7,540 5,594 38,061
135,708 52,003 15,393 10,676 9,155 6,885 41,596
Total 249,033 62,913 25,228 20,455 18,687 16,302 105,448
aExpected payments include interest totalling $4,227 million ($866 million in 2016, $754 million in 2017, $649 million in 2018, $541 million in 2019, $432 million in 2020 and $985 million thereafter).
bExpected payments include interest totalling $757 million ($62 million in 2016, $58 million in 2017, $55 million in 2018, $51 million in 2019, $46 million in 2020 and $485 million thereafter).
cThe amounts are undiscounted. Environmental liabilities include those relating to the Gulf of Mexico oil spill.
dRepresents the expected future contributions to funded pension plans and payments by the group for unfunded pension plans and the expected future payments for other post-retirement benefits.
eThe future minimum lease payments are before deducting related rental income from operating sub-leases. In the case of an operating lease entered into solely by BP as the operator of a joint
operation, the amounts shown in the table represent the net future minimum lease payments, after deducting amounts reimbursed, or to be reimbursed, by joint operation partners. Where BP is not
the operator of a joint operation, BP’s share of the future minimum lease payments are included in the amounts shown, whether BP has co-signed the lease or not. Where operating lease costs are
incurred in relation to the hire of equipment used in connection with a capital project, some or all of the cost may be capitalized as part of the capital cost of the project.
fRepresents any agreement to purchase goods or services that is enforceable and legally binding and that specifies all significant terms (such as fixed or minimum purchase volumes, timing of purchase
and pricing provisions). Agreements that do not specify all significant terms, or that are not enforceable, are excluded. The amounts shown include arrangements to secure long-term access to supplies
of crude oil, natural gas, feedstocks and pipeline systems. In addition, the amounts shown for 2016 include purchase commitments existing at 31 December 2015 entered into principally to meet the
group’s short-term manufacturing and marketing requirements. The price risk associated with these crude oil, natural gas and power contracts is discussed in Financial statements – Note 28.
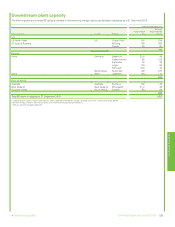
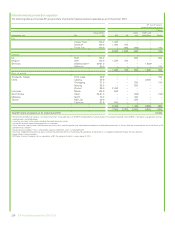
The following table summarizes the nature of the group’s unconditional purchase obligations.
$ million
Payments due by period
Unconditional purchase obligations Total 2016 2017 2018 2019 2020
2021 and
thereafter
Crude oil and oil products 47,466 28,715 4,534 3,127 2,308 2,008 6,774
Natural gas 21,322 11,639 3,791 2,221 1,480 767 1,424
Chemicals and other refinery feedstocks 6,464 2,210 1,215 1,295 1,340 264 140
Power 4,918 2,558 1,031 478 292 121 438
Utilities 630 197 174 115 64 20 60
Transportation 21,138 1,190 1,008 971 960 1,291 15,718
Use of facilities and services 18,348 1,350 736 536 1,096 1,123 13,507
Total 120,286 47,859 12,489 8,743 7,540 5,594 38,061
220 BP Annual Report and Form 20-F 2015