BP 2015 Annual Report Download - page 153
Download and view the complete annual report
Please find page 153 of the 2015 BP annual report below. You can navigate through the pages in the report by either clicking on the pages listed below, or by using the keyword search tool below to find specific information within the annual report.-
 1
1 -
2
-
3
-
4
-
5
-
6
-
7
-
8
-
9
-
10
-
11
-
12
-
13
-
14
-
15
-
16
-
17
-
18
-
19
-
20
-
21
-
22
-
23
-
24
-
25
-
26
-
27
-
28
-
29
-
30
-
31
-
32
-
33
-
34
-
35
-
36
-
37
-
38
-
39
-
40
-
41
-
42
-
43
-
44
-
45
-
46
-
47
-
48
-
49
-
50
-
51
-
52
-
53
-
54
-
55
-
56
-
57
-
58
-
59
-
60
-
61
-
62
-
63
-
64
-
65
-
66
-
67
-
68
-
69
-
70
-
71
-
72
-
73
-
74
-
75
-
76
-
77
-
78
-
79
-
80
-
81
-
82
-
83
-
84
-
85
-
86
-
87
-
88
-
89
-
90
-
91
-
92
-
93
-
94
-
95
-
96
-
97
-
98
-
99
-
100
-
101
-
102
-
103
-
104
-
105
-
106
-
107
-
108
-
109
-
110
-
111
-
112
-
113
-
114
-
115
-
116
-
117
-
118
-
119
-
120
-
121
-
122
-
123
-
124
-
125
-
126
-
127
-
128
-
129
-
130
-
131
-
132
-
133
-
134
-
135
-
136
-
137
-
138
-
139
-
140
-
141
-
142
-
 143
143 -
 144
144 -
 145
145 -
 146
146 -
 147
147 -
 148
148 -
 149
149 -
 150
150 -
 151
151 -
 152
152 -
 153
153 -
 154
154 -
 155
155 -
 156
156 -
 157
157 -
 158
158 -
 159
159 -
 160
160 -
 161
161 -
 162
162 -
 163
163 -
164
-
165
-
166
-
167
-
168
-
169
-
170
-
171
-
172
-
173
-
174
-
175
-
176
-
177
-
178
-
179
-
180
-
181
-
182
-
183
-
184
-
185
-
186
-
187
-
188
-
189
-
190
-
191
-
192
-
193
-
194
-
195
-
196
-
197
-
198
-
199
-
200
-
201
-
202
-
203
-
204
-
205
-
206
-
207
-
208
-
209
-
210
-
211
-
212
-
213
-
214
-
215
-
216
-
217
-
218
-
219
-
220
-
221
-
222
-
223
-
224
-
225
-
226
-
227
-
228
-
229
-
230
-
231
-
232
-
233
-
234
-
235
-
236
-
237
-
238
-
239
-
240
-
241
-
242
-
243
-
244
-
245
-
246
-
247
-
248
-
249
-
250
-
251
-
252
-
253
-
254
-
255
-
256
-
257
-
258
-
259
-
260
-
261
-
262
-
263
-
264
-
265
-
266
 |
 |

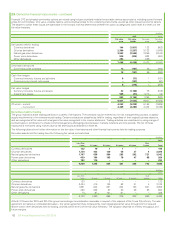
28. Financial instruments and financial risk factors – continued
(i) Commodity price risk
The group’s integrated supply and trading function uses conventional financial and commodity instruments and physical cargoes and pipeline positions
available in the related commodity markets. Oil and natural gas swaps, options and futures are used to mitigate price risk. Power trading is undertaken
using a combination of over-the-counter forward contracts and other derivative contracts, including options and futures. This activity is on both a
standalone basis and in conjunction with gas derivatives in relation to gas-generated power margin. In addition, NGLs are traded around certain US
inventory locations using over-the-counter forward contracts in conjunction with over-the-counter swaps, options and physical inventories.
The group measures market risk exposure arising from its trading positions in liquid periods using value-at-risk techniques. These techniques make a
statistical assessment of the market risk arising from possible future changes in market prices over a one-day holding period. The value-at-risk measure
is supplemented by stress testing. Trading activity occurring in liquid periods is subject to value-at-risk limits for each trading activity and for this trading
activity in total. The board has delegated a limit of $100 million value at risk in support of this trading activity. Alternative measures are used to monitor
exposures which are outside liquid periods and which cannot be actively risk-managed.
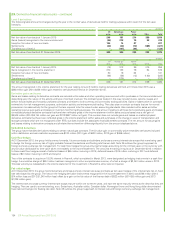
(ii) Foreign currency exchange risk
Where the group enters into foreign currency exchange contracts for entrepreneurial trading purposes the activity is controlled using trading value-at-
risk techniques as explained above.
Since BP has global operations, fluctuations in foreign currency exchange rates can have a significant effect on the group’s reported results. The
effects of most exchange rate fluctuations are absorbed in business operating results through changing cost competitiveness, lags in market
adjustment to movements in rates and translation differences accounted for on specific transactions. For this reason, the total effect of exchange rate
fluctuations is not identifiable separately in the group’s reported results. The main underlying economic currency of the group’s cash flows is the US
dollar. This is because BP’s major product, oil, is priced internationally in US dollars. BP’s foreign currency exchange management policy is to limit
economic and material transactional exposures arising from currency movements against the US dollar. The group co-ordinates the handling of foreign
currency exchange risks centrally, by netting off naturally-occurring opposite exposures wherever possible, and then managing any material residual
foreign currency exchange risks.
The group manages these exposures by constantly reviewing the foreign currency economic value at risk and aims to manage such risk to keep the
12-month foreign currency value at risk below $400 million. At no point over the past three years did the value at risk exceed the maximum risk limit.
The most significant exposures relate to capital expenditure commitments and other UK, Eurozone and Australian operational requirements, for which
hedging programmes are in place and hedge accounting is applied as outlined in Note 1.
For highly probable forecast capital expenditures the group locks in the US dollar cost of non-US dollar supplies by using currency forwards and futures.
The main exposures are sterling, euro, Australian dollar and South Korean won. At 31 December 2015 the most significant open contracts in place
were for $627 million sterling (2014 $321 million sterling).
For other UK, Eurozone and Australian operational requirements the group uses cylinders (purchased call and sold put options) to manage the
estimated exposures on a 12-month rolling basis. At 31 December 2015, the open positions relating to cylinders consisted of receive sterling, pay US
dollar cylinders for $2,479 million (2014 $2,787 million); receive euro, pay US dollar cylinders for $560 million (2014 $867 million); receive Australian
dollar, pay US dollar cylinders for $312 million (2014 $418 million).
In addition, most of the group’s borrowings are in US dollars or are hedged with respect to the US dollar. At 31 December 2015, the total foreign
currency net borrowings not swapped into US dollars amounted to $826 million (2014 $871 million).
(iii) Interest rate risk
Where the group enters into money market contracts for entrepreneurial trading purposes the activity is controlled using value-at-risk techniques as
described above.
BP is also exposed to interest rate risk from the possibility that changes in interest rates will affect future cash flows or the fair values of its financial
instruments, principally finance debt. While the group issues debt in a variety of currencies based on market opportunities, it uses derivatives to swap
the debt to a floating rate exposure, mainly to US dollar floating, but in certain defined circumstances maintains a US dollar fixed rate exposure for a
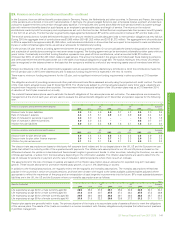
proportion of debt. The proportion of floating rate debt net of interest rate swaps at 31 December 2015 was 79% of total finance debt outstanding
(2014 71%). The weighted average interest rate on finance debt at 31 December 2015 was 2% (2014 2%) and the weighted average maturity of fixed
rate debt was five years (2014 four years).
The group’s earnings are sensitive to changes in interest rates on the floating rate element of the group’s finance debt. If the interest rates applicable
to floating rate instruments were to have increased by one percentage point on 1 January 2016, it is estimated that the group’s finance costs for 2016
would increase by approximately $419 million (2014 $377 million increase).
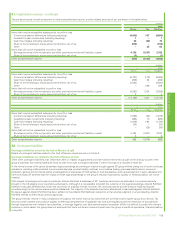
(b) Credit risk
Credit risk is the risk that a customer or counterparty to a financial instrument will fail to perform or fail to pay amounts due causing financial loss tothe
group and arises from cash and cash equivalents, derivative financial instruments and deposits with financial institutions and principally from credit
exposures to customers relating to outstanding receivables. Credit exposure also exists in relation to guarantees issued by group companies under
which the outstanding exposure incremental to that recognized on the balance sheet at 31 December 2015 was $35 million (2014 $83 million) in
respect of liabilities of joint ventures and associates and $163 million (2014 $244 million) in respect of liabilities of other third parties.
The group has a credit policy, approved by the CFO that is designed to ensure that consistent processes are in place throughout the group to measure
and control credit risk. Credit risk is considered as part of the risk-reward balance of doing business. On entering into any business contract the extent
to which the arrangement exposes the group to credit risk is considered. Key requirements of the policy include segregation of credit approval
authorities from any sales, marketing or trading teams authorized to incur credit risk; the establishment of credit systems and processes to ensure that
all counterparty exposure is rated and that all counterparty exposure and limits can be monitored and reported; and the timely identification and
reporting of any non-approved credit exposures and credit losses. While each segment is responsible for its own credit risk management and reporting
consistent with group policy, the treasury function holds group-wide credit risk authority and oversight responsibility for exposure to banks and financial
institutions.
The maximum credit exposure associated with financial assets is equal to the carrying amount. The group does not aim to remove credit risk entirely
but expects to experience a certain level of credit losses. As at 31 December 2015, the group had in place credit enhancements designed to mitigate
approximately $10.9 billion of credit risk (2014 $10.8 billion). Reports are regularly prepared and presented to the GFRC that cover the group’s overall
credit exposure and expected loss trends, exposure by segment, and overall quality of the portfolio.
BP Annual Report and Form 20-F 2015 149
Financial statements