BP 2015 Annual Report Download - page 137
Download and view the complete annual report
Please find page 137 of the 2015 BP annual report below. You can navigate through the pages in the report by either clicking on the pages listed below, or by using the keyword search tool below to find specific information within the annual report.-
 1
1 -
2
-
3
-
4
-
5
-
6
-
7
-
8
-
9
-
10
-
11
-
12
-
13
-
14
-
15
-
16
-
17
-
18
-
19
-
20
-
21
-
22
-
23
-
24
-
25
-
26
-
27
-
28
-
29
-
30
-
31
-
32
-
33
-
34
-
35
-
36
-
37
-
38
-
39
-
40
-
41
-
42
-
43
-
44
-
45
-
46
-
47
-
48
-
49
-
50
-
51
-
52
-
53
-
54
-
55
-
56
-
57
-
58
-
59
-
60
-
61
-
62
-
63
-
64
-
65
-
66
-
67
-
68
-
69
-
70
-
71
-
72
-
73
-
74
-
75
-
76
-
77
-
78
-
79
-
80
-
81
-
82
-
83
-
84
-
85
-
86
-
87
-
88
-
89
-
90
-
91
-
92
-
93
-
94
-
95
-
96
-
97
-
98
-
99
-
100
-
101
-
102
-
103
-
104
-
105
-
106
-
107
-
108
-
109
-
110
-
111
-
112
-
113
-
114
-
115
-
116
-
117
-
118
-
119
-
120
-
121
-
122
-
123
-
124
-
125
-
126
-
 127
127 -
 128
128 -
 129
129 -
 130
130 -
 131
131 -
 132
132 -
 133
133 -
 134
134 -
 135
135 -
 136
136 -
 137
137 -
 138
138 -
 139
139 -
 140
140 -
 141
141 -
 142
142 -
 143
143 -
 144
144 -
 145
145 -
 146
146 -
 147
147 -
148
-
149
-
150
-
151
-
152
-
153
-
154
-
155
-
156
-
157
-
158
-
159
-
160
-
161
-
162
-
163
-
164
-
165
-
166
-
167
-
168
-
169
-
170
-
171
-
172
-
173
-
174
-
175
-
176
-
177
-
178
-
179
-
180
-
181
-
182
-
183
-
184
-
185
-
186
-
187
-
188
-
189
-
190
-
191
-
192
-
193
-
194
-
195
-
196
-
197
-
198
-
199
-
200
-
201
-
202
-
203
-
204
-
205
-
206
-
207
-
208
-
209
-
210
-
211
-
212
-
213
-
214
-
215
-
216
-
217
-
218
-
219
-
220
-
221
-
222
-
223
-
224
-
225
-
226
-
227
-
228
-
229
-
230
-
231
-
232
-
233
-
234
-
235
-
236
-
237
-
238
-
239
-
240
-
241
-
242
-
243
-
244
-
245
-
246
-
247
-
248
-
249
-
250
-
251
-
252
-
253
-
254
-
255
-
256
-
257
-
258
-
259
-
260
-
261
-
262
-
263
-
264
-
265
-
266
 |
 |

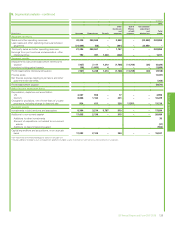
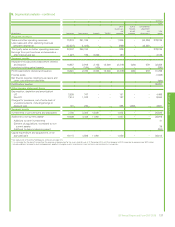
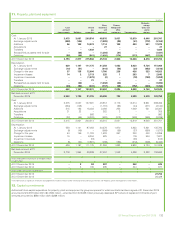
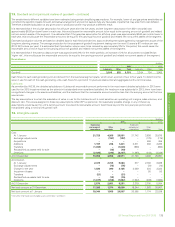
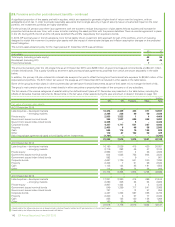
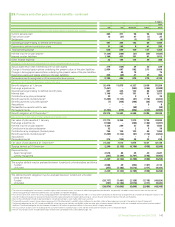
11. Property, plant and equipment
$ million
Land
and land
improvements Buildings
Oil and
gas
propertiesa
Plant,
machinery
and
equipment
Fixtures,
fittings and
office
equipment Transportation
Oil depots,
storage
tanks and
service
stations Total
Cost
At 1 January 2015 3,415 3,061 200,514 48,815 3,031 13,819 9,046 281,701
Exchange adjustments (259) (144) – (1,828) (89) (61) (772) (3,153)
Additions 96 122 14,574 1,114 129 493 551 17,079
Acquisitions –– –27 – – –27
Transfers – – 1,039 – – – – 1,039
Reclassified as assets held for sale – (66) – (1,364) (31) – – (1,461)
Deletions (58) (96) (561) (1,020) (174) (213) (407) (2,529)
At 31 December 2015 3,194 2,877 215,566 45,744 2,866 14,038 8,418 292,703
Depreciation
At 1 January 2015 639 1,197 111,175 21,358 1,983 8,933 5,724 151,009
Exchange adjustments (10) (51) – (914) (56) (33) (452) (1,516)
Charge for the year 37 135 12,004 1,760 238 426 323 14,923
Impairment losses 14 2 2,113 225 1 283 7 2,645
Impairment reversals – – (1,079) (2) – (18) (159) (1,258)
Transfers – – 21 – – – – 21
Reclassified as assets held for sale – (33) – (1,038) (24) – – (1,095)
Deletions (38) (93) (403) (737) (58) (152) (303) (1,784)
At 31 December 2015 642 1,157 123,831 20,652 2,084 9,439 5,140 162,945
Net book amount at 31
December 2015 2,552 1,720 91,735 25,092 782 4,599 3,278 129,758
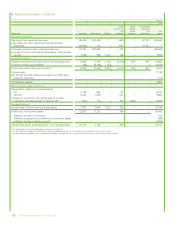
Cost
At 1 January 2014 3,375 3,027 187,691 48,912 3,176 13,314 9,961 269,456
Exchange adjustments (284) (105) – (1,737) (93) (44) (871) (3,134)
Additions 315 183 18,033 2,008 258 1,049 521 22,367
Acquisitions 31 22 – 252 3 – – 308
Transfers – – 993 – – – – 993
Deletions (22) (66) (6,203) (620) (313) (500) (565) (8,289)
At 31 December 2014 3,415 3,061 200,514 48,815 3,031 13,819 9,046 281,701
Depreciation
At 1 January 2014 550 1,141 97,063 20,378 1,970 8,833 5,831 135,766
Exchange adjustments (5) (46) – (989) (56) (27) (550) (1,673)
Charge for the year 84 156 11,728 1,833 267 343 448 14,859
Impairment losses 15 – 6,304 625 – 179 504 7,627
Impairment reversals – – (19) – – (83) – (102)
Deletions (5) (54) (3,901) (489) (198) (312) (509) (5,468)
At 31 December 2014 639 1,197 111,175 21,358 1,983 8,933 5,724 151,009
Net book amount at 31
December 2014 2,776 1,864 89,339 27,457 1,048 4,886 3,322 130,692
Assets held under finance leases at net book amount
included above
At 31 December 2015 – 2 84 297 – 242 – 625
At 31 December 2014 – 3 135 295 – 244 – 677
Assets under construction included above
At 31 December 2015 27,755
At 31 December 2014 26,429
aFor information on significant estimates and judgements made in relation to the estimation of oil and natural reserves see Property, plant and equipment within Note 1.
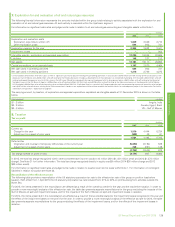
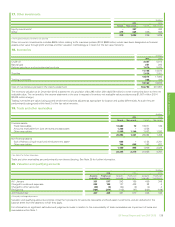
12. Capital commitments
Authorized future capital expenditure for property, plant and equipment by group companies for which contracts had been signed at 31 December 2015
amounted to $10,379 million (2014 $14,590 million – amended from $15,635 million previously disclosed). BP’s share of capital commitments of joint
ventures amounted to $586 million (2014 $369 million).
BP Annual Report and Form 20-F 2015 133
Financial statements