BP 2015 Annual Report Download - page 38
Download and view the complete annual report
Please find page 38 of the 2015 BP annual report below. You can navigate through the pages in the report by either clicking on the pages listed below, or by using the keyword search tool below to find specific information within the annual report.-
 1
1 -
2
-
3
-
4
-
5
-
6
-
7
-
8
-
9
-
10
-
11
-
12
-
13
-
14
-
15
-
16
-
17
-
18
-
19
-
20
-
21
-
22
-
23
-
24
-
25
-
26
-
27
-
 28
28 -
 29
29 -
 30
30 -
 31
31 -
 32
32 -
 33
33 -
 34
34 -
 35
35 -
 36
36 -
 37
37 -
 38
38 -
 39
39 -
 40
40 -
 41
41 -
 42
42 -
 43
43 -
 44
44 -
 45
45 -
 46
46 -
 47
47 -
 48
48 -
49
-
50
-
51
-
52
-
53
-
54
-
55
-
56
-
57
-
58
-
59
-
60
-
61
-
62
-
63
-
64
-
65
-
66
-
67
-
68
-
69
-
70
-
71
-
72
-
73
-
74
-
75
-
76
-
77
-
78
-
79
-
80
-
81
-
82
-
83
-
84
-
85
-
86
-
87
-
88
-
89
-
90
-
91
-
92
-
93
-
94
-
95
-
96
-
97
-
98
-
99
-
100
-
101
-
102
-
103
-
104
-
105
-
106
-
107
-
108
-
109
-
110
-
111
-
112
-
113
-
114
-
115
-
116
-
117
-
118
-
119
-
120
-
121
-
122
-
123
-
124
-
125
-
126
-
127
-
128
-
129
-
130
-
131
-
132
-
133
-
134
-
135
-
136
-
137
-
138
-
139
-
140
-
141
-
142
-
143
-
144
-
145
-
146
-
147
-
148
-
149
-
150
-
151
-
152
-
153
-
154
-
155
-
156
-
157
-
158
-
159
-
160
-
161
-
162
-
163
-
164
-
165
-
166
-
167
-
168
-
169
-
170
-
171
-
172
-
173
-
174
-
175
-
176
-
177
-
178
-
179
-
180
-
181
-
182
-
183
-
184
-
185
-
186
-
187
-
188
-
189
-
190
-
191
-
192
-
193
-
194
-
195
-
196
-
197
-
198
-
199
-
200
-
201
-
202
-
203
-
204
-
205
-
206
-
207
-
208
-
209
-
210
-
211
-
212
-
213
-
214
-
215
-
216
-
217
-
218
-
219
-
220
-
221
-
222
-
223
-
224
-
225
-
226
-
227
-
228
-
229
-
230
-
231
-
232
-
233
-
234
-
235
-
236
-
237
-
238
-
239
-
240
-
241
-
242
-
243
-
244
-
245
-
246
-
247
-
248
-
249
-
250
-
251
-
252
-
253
-
254
-
255
-
256
-
257
-
258
-
259
-
260
-
261
-
262
-
263
-
264
-
265
-
266
 |
 |

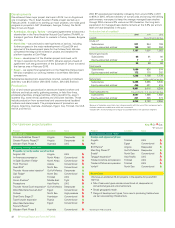
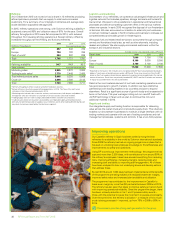
Downstream
We continued to improve our personal and process
safety and delivered strong operations and
marketing performance, contributing to record
replacement cost profit before interest and tax.
• Fuels and lubricants marketing – we invest in higher-returning
businesses with reliable cash flows and growth potential.
• Portfolio quality – we maintain our focus on quality by high-grading of
assets combined with capital discipline.
• Simplification and efficiency – we are embedding a culture of
simplification and efficiency to support performance improvement
and make our businesses even more competitive.
Disciplined execution of our strategy is helping improve our underlying
performance and create a more resilient business that is better able to
withstand external environmental impacts. This is with the aim of
ensuring Downstream remains a reliable source of cash flow for BP.
Our performance summary
• For Downstream safety performance see page 45.
• We have delivered record replacement cost profit before interest and
tax and pre-tax returns this year, demonstrating that we are
creating a more resilient Downstream business.
• We delivered strong availability and operational performance across
our refining portfolio and year-on-year improvement in utilization.
• We commenced the European launch of our BP fuels with ACTIVE
technology in Spain, which are designed to remove dirt and protect
car engines.
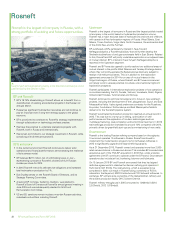
• We announced the agreement to restructure our German refining
joint operation with Rosneft.
• We halted operations at Bulwer refinery in Australia.
• In Air BP we completed the integration of Statoil Fuel and Retail’s
aviation business which added more than 70 airports to our global
network.
• In our lubricants business we launched Castrol’s Nexcel, an
innovative automotive oil-change technology.
• We completed start-up of the Zhuhai 3 plant in China – the world’s
largest single train purified terephthalic acid (PTA) unit.
• Our simplification and efficiency programmes contributed to material
progress in lowering cash costs . These programmes include
right-sizing the Downstream organization, implementing site-by-site
improvement plans to deliver manufacturing efficiency in refining and
petrochemicals, and focusing on third-party costs.
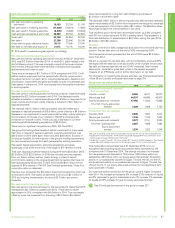
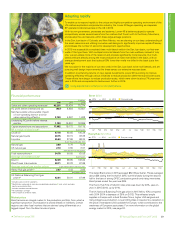
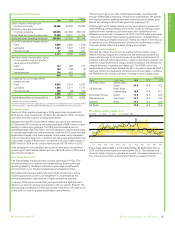
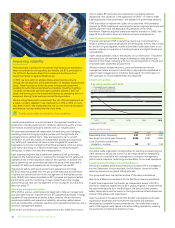
Downstream profitability ($ billion)
Underlying RC profit before interest and tax
RC profit before interest and tax
2011 2012 2013 2014 2015
8
6
4
2
5.5 6.0
2.9 2.9
4.4
7.1 7.5
3.6 3.7
6.5
See Financial performance on page 35 for the main factors influencing
downstream profit.
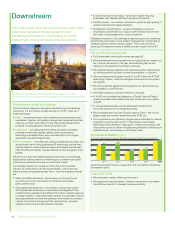
Outlook for 2016
• We anticipate a weaker refining environment.
• We expect the financial impact of refinery turnarounds to be higher
than 2015 as a result of increased turnaround activity.
Our business model and strategy
The Downstream segment has global manufacturing and marketing
operations. It is the product and service-led arm of BP, made up of
three businesses:
• Fuels – includes refineries, fuels marketing and convenience retail
businesses, together with global oil supply and trading activities that
make up our fuels value chains (FVCs). We sell refined petroleum
products including gasoline, diesel and aviation fuel.
• Lubricants – manufactures and markets lubricants and related
products and services globally, adding value through brand,
technology and relationships, such as collaboration with original
equipment manufacturing partners.
• Petrochemicals – manufactures, sells and distributes products, that
are produced mainly using proprietary BP technology, and are then
used by others to make essential consumer products such as paint,
plastic bottles and textiles. We also license our technologies to third
parties.
We aim to run safe and reliable operations across all our businesses,
supported by leading brands and technologies, to deliver high-quality
products and services that meet our customers’ needs.
Our strategy focuses on a quality portfolio that aims to lead the
industry, as measured by net income per barrel , with improving
returns and growing operating cash flow . Our five strategic priorities
are:
• Safe and reliable operations – this remains our first priority and
we continue to drive improvement in personal and process
safety performance.
• Advantaged manufacturing – we continue to build a top-quartile
refining business by having a competitively advantaged portfolio
underpinned by operational excellence that helps to reduce exposure
to margin volatility. In petrochemicals we seek to sustainably improve
earnings potential and make the business more resilient to a bottom
of cycle environment through portfolio repositioning, improved
operational performance and efficiency benefits.
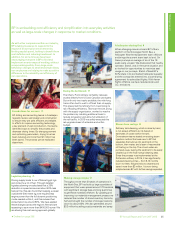
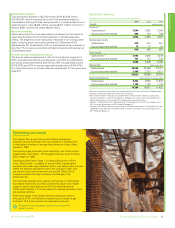
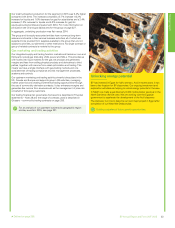
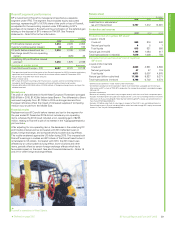
The Cherry Point refinery processes crude oil sourced from Alaska,
mid-continent US and Canada and has a capacity of 234,000 barrels per day.
BP Annual Report and Form 20-F 201534