BP 2015 Annual Report Download - page 32
Download and view the complete annual report
Please find page 32 of the 2015 BP annual report below. You can navigate through the pages in the report by either clicking on the pages listed below, or by using the keyword search tool below to find specific information within the annual report.-
 1
1 -
2
-
3
-
4
-
5
-
6
-
7
-
8
-
9
-
10
-
11
-
12
-
13
-
14
-
15
-
16
-
17
-
18
-
19
-
20
-
21
-
 22
22 -
 23
23 -
 24
24 -
 25
25 -
 26
26 -
 27
27 -
 28
28 -
 29
29 -
 30
30 -
 31
31 -
 32
32 -
 33
33 -
 34
34 -
 35
35 -
 36
36 -
 37
37 -
 38
38 -
 39
39 -
 40
40 -
 41
41 -
 42
42 -
43
-
44
-
45
-
46
-
47
-
48
-
49
-
50
-
51
-
52
-
53
-
54
-
55
-
56
-
57
-
58
-
59
-
60
-
61
-
62
-
63
-
64
-
65
-
66
-
67
-
68
-
69
-
70
-
71
-
72
-
73
-
74
-
75
-
76
-
77
-
78
-
79
-
80
-
81
-
82
-
83
-
84
-
85
-
86
-
87
-
88
-
89
-
90
-
91
-
92
-
93
-
94
-
95
-
96
-
97
-
98
-
99
-
100
-
101
-
102
-
103
-
104
-
105
-
106
-
107
-
108
-
109
-
110
-
111
-
112
-
113
-
114
-
115
-
116
-
117
-
118
-
119
-
120
-
121
-
122
-
123
-
124
-
125
-
126
-
127
-
128
-
129
-
130
-
131
-
132
-
133
-
134
-
135
-
136
-
137
-
138
-
139
-
140
-
141
-
142
-
143
-
144
-
145
-
146
-
147
-
148
-
149
-
150
-
151
-
152
-
153
-
154
-
155
-
156
-
157
-
158
-
159
-
160
-
161
-
162
-
163
-
164
-
165
-
166
-
167
-
168
-
169
-
170
-
171
-
172
-
173
-
174
-
175
-
176
-
177
-
178
-
179
-
180
-
181
-
182
-
183
-
184
-
185
-
186
-
187
-
188
-
189
-
190
-
191
-
192
-
193
-
194
-
195
-
196
-
197
-
198
-
199
-
200
-
201
-
202
-
203
-
204
-
205
-
206
-
207
-
208
-
209
-
210
-
211
-
212
-
213
-
214
-
215
-
216
-
217
-
218
-
219
-
220
-
221
-
222
-
223
-
224
-
225
-
226
-
227
-
228
-
229
-
230
-
231
-
232
-
233
-
234
-
235
-
236
-
237
-
238
-
239
-
240
-
241
-
242
-
243
-
244
-
245
-
246
-
247
-
248
-
249
-
250
-
251
-
252
-
253
-
254
-
255
-
256
-
257
-
258
-
259
-
260
-
261
-
262
-
263
-
264
-
265
-
266
 |
 |

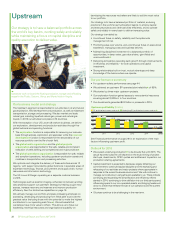
Our business model and strategy
The Upstream segment is responsible for our activities in oil and natural
gas exploration, field development and production, as well as midstream
transportation, storage and processing. We also market and trade
natural gas, including liquefied natural gas, power and natural gas
liquids. In 2015 our activities took place in 25 countries.
With the exception of our US Lower 48 onshore business, we deliver
our exploration, development and production activities through five
global technical and operating functions:
• The exploration function is responsible for renewing our resource
base through access, exploration and appraisal, while the reservoir
development function is responsible for the stewardship of our
resource portfolio over the life of each field.
• The global wells organization and the global projects
organization are responsible for the safe, reliable and compliant
execution of wells (drilling and completions) and major projects .
• The global operations organization is responsible for safe, reliable
and compliant operations, including upstream production assets and
midstream transportation and processing activities.
We optimize and integrate the delivery of these activities across 12
regions, with support provided by global functions in specialist areas of
expertise: technology, finance, procurement and supply chain, human
resources and information technology.
The US Lower 48 began operating as a separate onshore business
in 2015.
Technologies such as seismic imaging, enhanced oil recovery and big
data analytics support our upstream strategy by helping us gain new
access, increase recovery and reserves and improve production
efficiency. See Our distinctive capabilities on page 16.
We actively manage our portfolio and place increasing emphasis on
accessing, developing and producing from fields able to provide the
greatest value (including those with the potential to make the highest
contribution to our operating cash flow ). We sell assets that
we believe have more value to others. This allows us to focus our
leadership, technical resources and organizational capability on
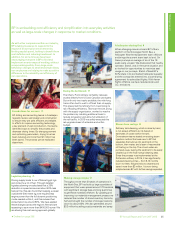
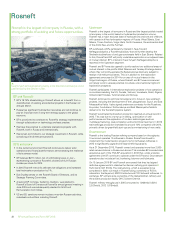
Upstream
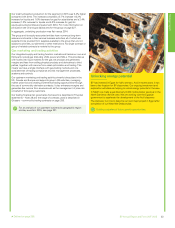
Operators work on board the floating production, storage and offloading
vessel in the Plutão, Saturno, Vénus and Marte fields in Angola.
Our strategy is to have a balanced portfolio across
the world’s key basins, working safely and reliably
while maintaining a focus on capital discipline and
quality execution to deliver value.
developing the resources we believe are likely to add the most value
to our portfolio.
Our strategy is to have a balanced portfolio of material, enduring
positions in the world’s key hydrocarbon basins; to employ capital
and execute projects and other activitiesefficiently; and to operate
safely and reliably in every basin to deliver increasing value.
Our strategy is enabled by:
• A continued focus on safety, reliability and the systematic
management of risk.
• Prioritizing value over volume, and a continuous focus on executional
excellence, managing costs and business delivery.
• Maintaining disciplined investment in a balanced portfolio of
opportunities, in deep water, gas value chains, giant fields and
unconventionals .
• Delivering competitive operating cash growth through improvements
in efficiency and reliability – for both operations and capital
investment.
• Strong relationships built on trust, mutual advantage and deep
knowledge of the basins where we operate.
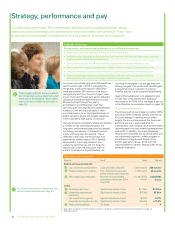
Our performance summary
• For upstream safety performance see page 44.
• We achieved an upstream BP-operated plant reliability of 95%.
• We started up three major upstream projects.
• Our exploration function gained access to new potential resources
covering almost 8,000km2 in four countries.
• Our divestments generated $0.8 billion in proceeds in 2015.
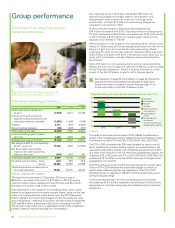
See Financial performance on page 29 for an explanation of the main
factors influencing upstream profit.
Outlook for 2016
• We expect underlying production to be broadly flat with 2015. The
actual reported outcome will depend on the exact timing of project
start-ups, divestments, OPEC quotas and entitlement impacts in our
production-sharing agreements.
• Capital investment is expected to decrease, largely reflecting our
commitment to continued capital discipline and the rephasing and
refocusing of our activities and major projects where appropriate in
response to the current business environment. We will continue to
manage our costs down using all levers available to us. These include
continuing and expanding the simplification and efficiency efforts
started in 2014, continuing to drive deflation into our third-party spend,
influencing spend in our non-operated assets, and bringing headcount
down to a level that reflects the size of our operations and the current
environment.
• Oil prices continue to be challenging in the near term.
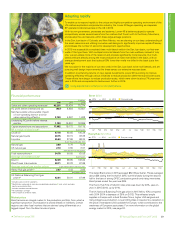
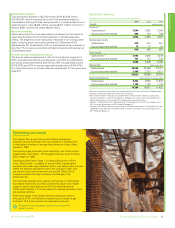
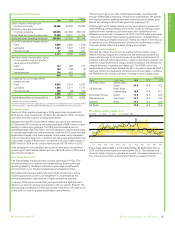
Upst
ream profitability ($ billion)
Underlying RC profit before interest and taxRC profit before interest and tax
22.5 19.4 15.2
8.9
-10
0
10
20
30
40
20152014201320122011
16.7
26.4 25.2
18.3
-0.9 1.2
BP Annual Report and Form 20-F 201528