BP 2015 Annual Report Download - page 201
Download and view the complete annual report
Please find page 201 of the 2015 BP annual report below. You can navigate through the pages in the report by either clicking on the pages listed below, or by using the keyword search tool below to find specific information within the annual report.-
 1
1 -
2
-
3
-
4
-
5
-
6
-
7
-
8
-
9
-
10
-
11
-
12
-
13
-
14
-
15
-
16
-
17
-
18
-
19
-
20
-
21
-
22
-
23
-
24
-
25
-
26
-
27
-
28
-
29
-
30
-
31
-
32
-
33
-
34
-
35
-
36
-
37
-
38
-
39
-
40
-
41
-
42
-
43
-
44
-
45
-
46
-
47
-
48
-
49
-
50
-
51
-
52
-
53
-
54
-
55
-
56
-
57
-
58
-
59
-
60
-
61
-
62
-
63
-
64
-
65
-
66
-
67
-
68
-
69
-
70
-
71
-
72
-
73
-
74
-
75
-
76
-
77
-
78
-
79
-
80
-
81
-
82
-
83
-
84
-
85
-
86
-
87
-
88
-
89
-
90
-
91
-
92
-
93
-
94
-
95
-
96
-
97
-
98
-
99
-
100
-
101
-
102
-
103
-
104
-
105
-
106
-
107
-
108
-
109
-
110
-
111
-
112
-
113
-
114
-
115
-
116
-
117
-
118
-
119
-
120
-
121
-
122
-
123
-
124
-
125
-
126
-
127
-
128
-
129
-
130
-
131
-
132
-
133
-
134
-
135
-
136
-
137
-
138
-
139
-
140
-
141
-
142
-
143
-
144
-
145
-
146
-
147
-
148
-
149
-
150
-
151
-
152
-
153
-
154
-
155
-
156
-
157
-
158
-
159
-
160
-
161
-
162
-
163
-
164
-
165
-
166
-
167
-
168
-
169
-
170
-
171
-
172
-
173
-
174
-
175
-
176
-
177
-
178
-
179
-
180
-
181
-
182
-
183
-
184
-
185
-
186
-
187
-
188
-
189
-
190
-
 191
191 -
 192
192 -
 193
193 -
 194
194 -
 195
195 -
 196
196 -
 197
197 -
 198
198 -
 199
199 -
 200
200 -
 201
201 -
 202
202 -
 203
203 -
 204
204 -
 205
205 -
 206
206 -
 207
207 -
 208
208 -
 209
209 -
 210
210 -
 211
211 -
212
-
213
-
214
-
215
-
216
-
217
-
218
-
219
-
220
-
221
-
222
-
223
-
224
-
225
-
226
-
227
-
228
-
229
-
230
-
231
-
232
-
233
-
234
-
235
-
236
-
237
-
238
-
239
-
240
-
241
-
242
-
243
-
244
-
245
-
246
-
247
-
248
-
249
-
250
-
251
-
252
-
253
-
254
-
255
-
256
-
257
-
258
-
259
-
260
-
261
-
262
-
263
-
264
-
265
-
266
 |
 |

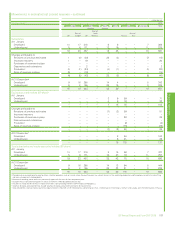
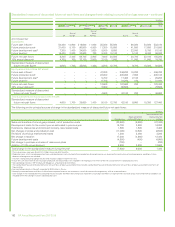
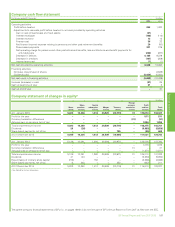
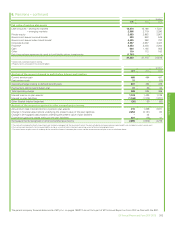
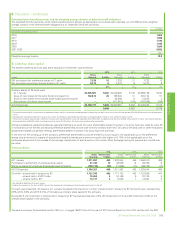
Company cash flow statement
For the year ended 31 December $ million
2015 2014
Operating activities
Profit before taxation 653 1,420
Adjustments to reconcile profit before taxation to net cash provided by operating activities
Gain on sale of businesses and fixed assets (31) –
Interest receivable (108) (118)
Interest received 13 18
Finance cost 36 23
Net finance (income) expense relating to pensions and other post-retirement benefits 20 (50)
Share-based payments 321 379
Net operating charge for pensions and other post-retirement benefits, less contributions and benefit payments for
unfunded plans (263) (227)
Decrease in debtors 6,185 9,379
Decrease in creditors (197) (359)
Income taxes paid (1) (1)
Net cash provided by operating activities 6,628 10,464
Financing activities
Net issue (repurchase) of shares – (4,589)
Dividends paid (6,659) (5,850)
Net cash used in financing activities (6,659) (10,439)
Increase (decrease) in cash (31) 25
Cash at beginning of year 31 6
Cash at end of year –31
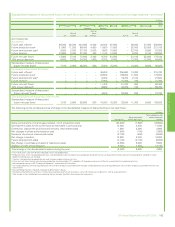
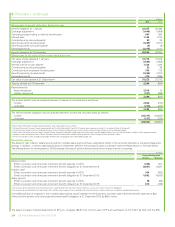
Company statement of changes in equitya
$ million
Share
capital
Share
premium
account
Capital
redemption
reserve
Merger
reserve
Treasury
shares
Foreign
currency
translation
reserve
Profit
and loss
account
Total
equity
At 1 January 2015 5,023 10,260 1,413 26,509 (20,719) 31 115,810 138,327
Profit for the year – – – – – – 571 571
Currency translation differences – – – – – (31) – (31)
Actuarial gain on pensions (net of tax) – – – – – – 1,894 1,894
Total comprehensive income 5,023 10,260 1,413 26,509 (20,719) – 118,275 140,761
Dividends 26 (26) – – – – (6,659) (6,659)
Share-based payments, net of tax – – – – 755 – (95) 660
At 31 December 2015 5,049 10,234 1,413 26,509 (19,964) – 111,521 134,762
At 1 January 2014 5,129 10,061 1,260 26,509 (20,971) – 125,806 147,794
Profit for the year – – – – – – 1,378 1,378
Currency translation differences – – – – – 31 – 31
Actuarial loss on pensions (net of tax) – – – – – – (1,871) (1,871)
Total comprehensive income 5,129 10,061 1,260 26,509 (20,971) 31 125,313 147,332
Dividends 41 (41) – – – – (5,850) (5,850)
Repurchases of ordinary share capital (153) – 153 – – – (3,366) (3,366)
Share-based payments, net of tax 6 240 – – 252 – (287) 211
At 31 December 2014 5,023 10,260 1,413 26,509 (20,719) 31 115,810 138,327
aSee Note 8 for further information.
The parent company financial statements of BP p.l.c. on pages 196-213 do not form part of BP’s Annual Report on Form 20-F as filed with the SEC.
Financial statements
BP Annual Report and Form 20-F 2015 197