Airtran 2010 Annual Report Download - page 67
Download and view the complete annual report
Please find page 67 of the 2010 Airtran annual report below. You can navigate through the pages in the report by either clicking on the pages listed below, or by using the keyword search tool below to find specific information within the annual report.-
 1
1 -
2
-
3
-
4
-
5
-
6
-
7
-
8
-
9
-
10
-
11
-
12
-
13
-
14
-
15
-
16
-
17
-
18
-
19
-
20
-
21
-
22
-
23
-
24
-
25
-
26
-
27
-
28
-
29
-
30
-
31
-
32
-
33
-
34
-
35
-
36
-
37
-
38
-
39
-
40
-
41
-
42
-
43
-
44
-
45
-
46
-
47
-
48
-
49
-
50
-
51
-
52
-
53
-
54
-
55
-
56
-
 57
57 -
 58
58 -
 59
59 -
 60
60 -
 61
61 -
 62
62 -
 63
63 -
 64
64 -
 65
65 -
 66
66 -
 67
67 -
 68
68 -
 69
69 -
 70
70 -
 71
71 -
 72
72 -
 73
73 -
 74
74 -
 75
75 -
 76
76 -
 77
77 -
78
-
79
-
80
-
81
-
82
-
83
-
84
-
85
-
86
-
87
-
88
-
89
-
90
-
91
-
92
-
93
-
94
-
95
-
96
-
97
-
98
-
99
-
100
-
101
-
102
-
103
-
104
-
105
-
106
-
107
-
108
-
109
-
110
-
111
-
112
-
113
-
114
-
115
-
116
-
117
-
118
-
119
-
120
-
121
-
122
-
123
-
124
-
125
-
126
-
127
-
128
-
129
-
130
-
131
-
132
-
133
-
134
-
135
-
136
-
137
 |
 |

In summary, our fuel-related derivative financial instruments impacted our 2010 financial statements as follows:
• We recorded a non-operating net gain on fuel-related derivative financial instruments of $8.4
million during 2010. During 2010, we realized losses related to derivative financial instruments
of $5.2 million.
• As of December 31, 2010, the estimated fair value of our fuel-related derivative financial
instruments was a net asset of $48.2 million. The fair value of our fuel-related derivatives is in
large part a function of the current market and futures prices of the underlying commodities.
Consequently, changes in the current market and futures prices tend to have a substantial
impact on the fair value of the fuel-related derivatives.
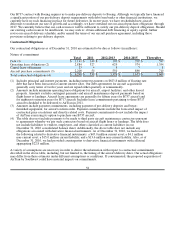
As of December 31, 2010, we had entered into fuel-related option agreements which pertain to 198 million gallons or 52
percent of our projected 2011 fuel requirements, and 20 million gallons or 5 percent of our projected 2012 fuel
requirements. As of December 31, 2010, we had no swap agreements or outstanding refinery-margin swap agreements.
For every dollar increase per barrel in crude oil or refining costs, our fuel expense (including taxes and into-plane fees) for
2011, before the impact of our derivative financial instruments, would increase approximately $9.6 million based on
projected operations.
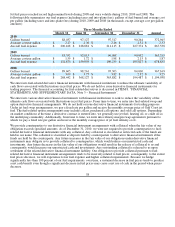
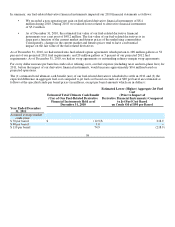
The (1) estimated total ultimate cash benefit (use) of our fuel-related derivatives scheduled to settle in 2011 and (2) the
expected difference in aggregate fuel cost compared to jet fuel cost based on crude oil at $90 per barrel are estimated as
follows at the specified crude per barrel prices (in millions, except per barrel amounts which are in dollars):
Estimated Total Ultimate Cash Benefit
(Use) of Our Fuel-Related Derivative
Financial Instruments Held as of
December 31, 2010
Estimated Lower (Higher) Aggregate Jet Fuel
Cost
(Prior to Impact of
Derivative Financial Instruments) Compared
to Jet Fuel Cost Based
on Crude Oil of $90 per Barrel
Year Ended December
31, 2011
Assumed average market
crude price:
$ 70 per barrel $ (12.9)$ 218.9
$ 90 per barrel 1.0 •
$ 110 per barrel 74.9 (218.9)
59