Airtran 2010 Annual Report Download - page 49
Download and view the complete annual report
Please find page 49 of the 2010 Airtran annual report below. You can navigate through the pages in the report by either clicking on the pages listed below, or by using the keyword search tool below to find specific information within the annual report.-
 1
1 -
2
-
3
-
4
-
5
-
6
-
7
-
8
-
9
-
10
-
11
-
12
-
13
-
14
-
15
-
16
-
17
-
18
-
19
-
20
-
21
-
22
-
23
-
24
-
25
-
26
-
27
-
28
-
29
-
30
-
31
-
32
-
33
-
34
-
35
-
36
-
37
-
38
-
 39
39 -
 40
40 -
 41
41 -
 42
42 -
 43
43 -
 44
44 -
 45
45 -
 46
46 -
 47
47 -
 48
48 -
 49
49 -
 50
50 -
 51
51 -
 52
52 -
 53
53 -
 54
54 -
 55
55 -
 56
56 -
 57
57 -
 58
58 -
 59
59 -
60
-
61
-
62
-
63
-
64
-
65
-
66
-
67
-
68
-
69
-
70
-
71
-
72
-
73
-
74
-
75
-
76
-
77
-
78
-
79
-
80
-
81
-
82
-
83
-
84
-
85
-
86
-
87
-
88
-
89
-
90
-
91
-
92
-
93
-
94
-
95
-
96
-
97
-
98
-
99
-
100
-
101
-
102
-
103
-
104
-
105
-
106
-
107
-
108
-
109
-
110
-
111
-
112
-
113
-
114
-
115
-
116
-
117
-
118
-
119
-
120
-
121
-
122
-
123
-
124
-
125
-
126
-
127
-
128
-
129
-
130
-
131
-
132
-
133
-
134
-
135
-
136
-
137
 |
 |

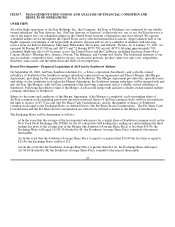
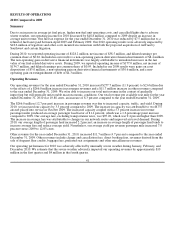
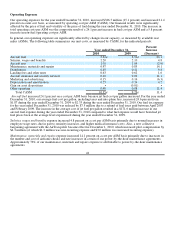
RESULTS OF OPERATIONS
2010 Compared to 2009
Summary
Due to an increase in average jet fuel prices, higher non-fuel unit operating costs, and cancelled flights due to adverse
winter weather, our operating income for 2010 decreased by $48.8 million compared to 2009 despite an increase in
average unit revenue. Our fuel tax expense for the year ended December 31, 2010 was reduced by $7.5 million due to a
refund of fuel taxes paid between April 2007 and February 2009. Our 2010 operating results were adversely impacted by
$18.6 million of legal fees and other costs incurred in connection with both the proposed acquisition of AirTran by
Southwest and certain litigation.
During 2010, we reported operating income of $128.2 million, net income of $38.5 million, and diluted earnings per
common share of $0.26. Included in our results is a non-operating gain on derivative financial instruments of $8.4 million.
The non-operating gain on derivative financial instruments was largely attributable to unrealized increases in the fair
value of our fuel-related derivative assets. During 2009, we reported operating income of $177.0 million, net income of
$134.7 million, and diluted earnings per common share of $0.95. Included in our 2009 results were gains on asset
dispositions of $3.0 million, a non-operating gain on derivative financial instruments of $30.6 million, and a non-
operating gain on extinguishment of debt of $4.3 million.
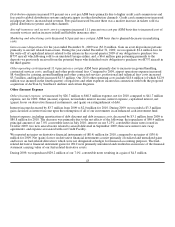
Operating Revenues
Our operating revenues for the year ended December 31, 2010 increased $277.7 million (11.9 percent) to $2.6 billion due
to the effects of a $266.0 million increase in passenger revenues and a $11.7 million increase in other revenues compared
to the year ended December 31, 2009. We were able to increase our total unit revenue in the context of gradually
improving but still generally unfavorable macroeconomic conditions. Our total revenue per available seat mile for the year
ended December 31, 2010 was 10.88 cents, an increase of 8.3 percent compared to the year ended December 31, 2009.
The $266.0 million (12.7 percent) increase in passenger revenue was due to increased capacity, traffic, and yield. During
2010, we increased our capacity by 3.3 percent compared to 2009. The increase in capacity was attributable to two B737
aircraft placed into service in October 2009. The increased capacity coupled with a 5.3 percent increase in revenue
passenger miles produced an average passenger load factor of 81.4 percent, which was a 1.6 percentage point increase
compared to 2009. Our average fare, excluding transportation taxes, was $95.26, which was 9.4 percent higher than 2009.
The increase in average fare was attributable to changes in our network routes and improved air travel demand. During
2010, our average length of passenger haul increased 2.2 percent; an increase in average length of passenger haul tends to
increase average fare and reduce average yield. Nonetheless, our average yield per revenue passenger mile increased 7.0
percent versus 2009 to 12.03 cents.
Other revenues for the year ended December 31, 2010, increased $11.7 million (4.7 percent) compared to the year ended
December 31, 2009. Other revenues include change and cancellation fees, direct booking fees, revenues derived from the
sale of frequent flyer credits, baggage fees, preferred seat assignments and other miscellaneous revenues.
Our operating performance for 2010 was adversely affected by unusually severe weather during January, February, and
December 2010. We estimate that the severe weather adversely impacted our operating revenues by approximately $10
million in the first quarter and $4 million in the fourth quarter.
41