Airtran 2010 Annual Report Download - page 52
Download and view the complete annual report
Please find page 52 of the 2010 Airtran annual report below. You can navigate through the pages in the report by either clicking on the pages listed below, or by using the keyword search tool below to find specific information within the annual report.-
 1
1 -
2
-
3
-
4
-
5
-
6
-
7
-
8
-
9
-
10
-
11
-
12
-
13
-
14
-
15
-
16
-
17
-
18
-
19
-
20
-
21
-
22
-
23
-
24
-
25
-
26
-
27
-
28
-
29
-
30
-
31
-
32
-
33
-
34
-
35
-
36
-
37
-
38
-
39
-
40
-
41
-
 42
42 -
 43
43 -
 44
44 -
 45
45 -
 46
46 -
 47
47 -
 48
48 -
 49
49 -
 50
50 -
 51
51 -
 52
52 -
 53
53 -
 54
54 -
 55
55 -
 56
56 -
 57
57 -
 58
58 -
 59
59 -
 60
60 -
 61
61 -
 62
62 -
63
-
64
-
65
-
66
-
67
-
68
-
69
-
70
-
71
-
72
-
73
-
74
-
75
-
76
-
77
-
78
-
79
-
80
-
81
-
82
-
83
-
84
-
85
-
86
-
87
-
88
-
89
-
90
-
91
-
92
-
93
-
94
-
95
-
96
-
97
-
98
-
99
-
100
-
101
-
102
-
103
-
104
-
105
-
106
-
107
-
108
-
109
-
110
-
111
-
112
-
113
-
114
-
115
-
116
-
117
-
118
-
119
-
120
-
121
-
122
-
123
-
124
-
125
-
126
-
127
-
128
-
129
-
130
-
131
-
132
-
133
-
134
-
135
-
136
-
137
 |
 |

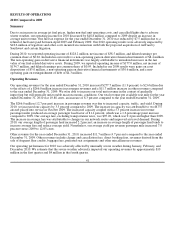
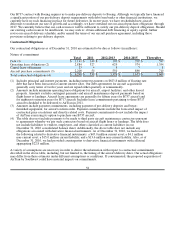
Income Tax Expense (Benefit)
Our effective income tax rate was 35.6 percent and 0.5 percent for the years ended December 31, 2010 and 2009,
respectively. Our effective tax rate can differ from the 37.2 percent composite statutory tax rate (35 percent federal
statutory rate plus the 2.2 percent effective state tax rate) due to changes in the valuation allowance on our deferred tax
assets, certain expenses which are not deductible for income tax purposes, and non-recurring discrete items related to
restricted stock vesting. Non-deductible expense items and discrete items tend to increase the effective tax rate when pre-
tax income is reported and tend to decrease the effective tax rate when a pre-tax loss is reported. During 2010, we reduced
the valuation allowance with a corresponding $4.0 million reduction to income tax expense for the period. During 2009,
we reported income before taxes but did not recognize material tax expense due to the reduction in the valuation
allowance which largely offset income tax expense for the period.
2009 Compared to 2008
Summary
Due to the pronounced reduction in the average cost of jet fuel per gallon during 2009 compared to 2008 and the actions
that we undertook, our operating income for 2009 increased by $252.8 million compared to 2008.
During 2009, we reported operating income of $177.0 million, net income of $134.7 million, and diluted earnings per
common share of $0.95. Included in our results are gains on asset dispositions of $3.0 million, a non-operating gain on
derivative financial instruments of $30.6 million, and a non-operating gain on extinguishment of debt of $4.3 million.
During 2008, we reported an operating loss of $75.8 million, a net loss of $266.3 million, and diluted loss per common
share of $2.44. Included in our 2008 results are gains on asset dispositions of $20.0 million, an impairment charge to
write-off goodwill of $8.4 million, and a non-operating loss on derivative financial instruments of $150.8 million.
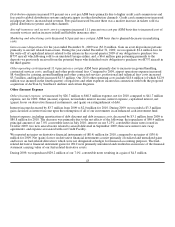
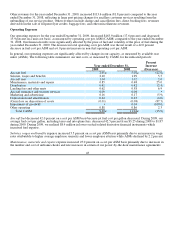
Operating Revenues
Our operating revenues for the year ended December 31, 2009 decreased $211.0 million (8.3 percent) to $2.3 billion due
to the net effect of a $324.6 million decrease in passenger revenues and a $113.6 million increase in other revenues
compared to the year ended December 31, 2008. Our total revenue per available seat mile for the year ended December
31, 2009 was 10.05 cents, a decrease of 6.3 percent compared to the year ended December 31, 2008. We believe that our
capacity reductions combined with increases in ancillary fees partially mitigated the unfavorable impact of adverse
macroeconomic conditions by preventing a more pronounced erosion of total unit revenues.
The $324.6 million (13.5 percent) decrease in 2009 passenger revenue compared to 2008 was due to lower capacity,
reduced traffic, and reduced passenger yield. We believe the reductions in traffic and yield were attributable in large part
to the weak air travel demand caused by adverse macroeconomic conditions. During 2009, we reduced our capacity, as
measured by available seat miles (ASMs), by 2.2 percent compared to 2008. The reduction in capacity was primarily the
intended consequence of actions we took in 2008 to defer aircraft deliveries and sell aircraft. The reduced capacity
coupled with a 1.9 percent decrease in revenue passenger miles produced an average passenger load factor of 79.8
percent, which was a 0.2 percentage point increase compared to the year ended December 31, 2008. Average yield per
revenue passenger mile was 11.24 cents, 11.7 percent lower than 2008. The decrease in average yield was in part
attributable to an increase in average length of passenger haul. During 2009, our average length of passenger haul
increased 0.6 percent; an increase in average length of passenger haul tends to increase average fare and tends to reduce
average yield.
44