Airtran 2010 Annual Report Download - page 50
Download and view the complete annual report
Please find page 50 of the 2010 Airtran annual report below. You can navigate through the pages in the report by either clicking on the pages listed below, or by using the keyword search tool below to find specific information within the annual report.-
 1
1 -
2
-
3
-
4
-
5
-
6
-
7
-
8
-
9
-
10
-
11
-
12
-
13
-
14
-
15
-
16
-
17
-
18
-
19
-
20
-
21
-
22
-
23
-
24
-
25
-
26
-
27
-
28
-
29
-
30
-
31
-
32
-
33
-
34
-
35
-
36
-
37
-
38
-
39
-
 40
40 -
 41
41 -
 42
42 -
 43
43 -
 44
44 -
 45
45 -
 46
46 -
 47
47 -
 48
48 -
 49
49 -
 50
50 -
 51
51 -
 52
52 -
 53
53 -
 54
54 -
 55
55 -
 56
56 -
 57
57 -
 58
58 -
 59
59 -
 60
60 -
61
-
62
-
63
-
64
-
65
-
66
-
67
-
68
-
69
-
70
-
71
-
72
-
73
-
74
-
75
-
76
-
77
-
78
-
79
-
80
-
81
-
82
-
83
-
84
-
85
-
86
-
87
-
88
-
89
-
90
-
91
-
92
-
93
-
94
-
95
-
96
-
97
-
98
-
99
-
100
-
101
-
102
-
103
-
104
-
105
-
106
-
107
-
108
-
109
-
110
-
111
-
112
-
113
-
114
-
115
-
116
-
117
-
118
-
119
-
120
-
121
-
122
-
123
-
124
-
125
-
126
-
127
-
128
-
129
-
130
-
131
-
132
-
133
-
134
-
135
-
136
-
137
 |
 |

Operating Expenses
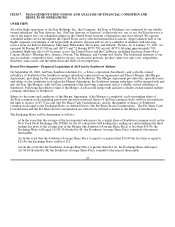
Our operating expenses for the year ended December 31, 2010, increased $326.5 million (15.1 percent) and increased 11.4
percent on a unit cost basis, as measured by operating cost per ASM (CASM). Our financial results were significantly
affected by the price of fuel and volatility of the price of fuel during the year ended December 31, 2010. The increase in
total operating costs per ASM was the composite result of a 24.1 percent increase in fuel cost per ASM and a 5.8 percent
increase in non-fuel operating cost per ASM.
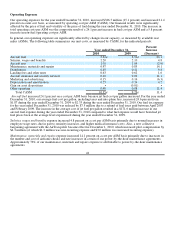
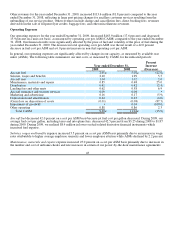
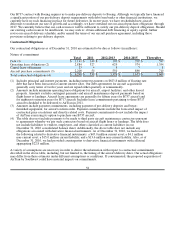
In general, our operating expenses are significantly affected by changes in our capacity, as measured by available seat
miles (ASMs). The following table summarizes our unit costs, as measured by CASM, for the indicated periods:
Year ended December 31, Percent
Increase
2010 2009 (Decrease)
Aircraft fuel 3.61¢ 2.91¢ 24.1
Salaries, wages and benefits 2.20 2.10 4.8
Aircraft rent 1.01 1.04 (2.9)
Maintenance, materials and repairs 0.97 0.85 14.1
Distribution 0.45 0.41 9.8
Landing fees and other rents 0.63 0.62 1.6
Aircraft insurance and security services 0.10 0.09 11.1
Marketing and advertising 0.15 0.16 (6.3)
Depreciation and amortization 0.25 0.24 4.2
Gain on asset dispositions • (0.01) •
Other operating 0.98 0.88 11.4
Total CASM 10.35¢ 9.29¢ 11.4
Aircraft fuel increased 24.1 percent on a cost per ASM basis because jet fuel cost per gallon increased. For the year ended
December 31, 2010, our average fuel cost per gallon, including taxes and into-plane fees, increased 24.6 percent from
$1.87 during the year ended December 31, 2009 to $2.33 during the year ended December 31, 2010. Our fuel tax expense
for the year ended December 31, 2010 was reduced by $7.5 million due to a refund of fuel taxes paid between April 2007
and February 2009. The increase in the average cost of jet fuel per gallon resulted in a $171.6 million increase in our
aircraft fuel expense during the year ended December 31, 2010 compared to what fuel expense would have been had jet
fuel prices been at the average level experienced during the year ended December 31, 2009.
Salaries, wages and benefits expense increased 4.8 percent on a cost per ASM basis primarily due to normal increases in
employee wage rates, due in part to seniority increases, and higher medical insurance costs. Also, a new collective
bargaining agreement with the AirTran pilots became effective December 1, 2010, which increased pilot compensation by
$4.3 million (of which $1.3 million was non-recurring expense and $3.0 million was increased recurring expense).
Maintenance, materials and repairs expense increased 14.1 percent on a cost per ASM basis primarily due to increases in
the number and cost of airframe checks and rate increases in certain of our power-by-the-hour maintenance agreements.
Approximately 76% of our maintenance, materials and repairs expense is attributable to power-by-the-hour maintenance
agreements.
42