Airtran 2001 Annual Report Download - page 11
Download and view the complete annual report
Please find page 11 of the 2001 Airtran annual report below. You can navigate through the pages in the report by either clicking on the pages listed below, or by using the keyword search tool below to find specific information within the annual report.-
 1
1 -
 2
2 -
 3
3 -
 4
4 -
 5
5 -
 6
6 -
 7
7 -
 8
8 -
 9
9 -
 10
10 -
 11
11 -
 12
12 -
 13
13 -
 14
14 -
 15
15 -
 16
16 -
 17
17 -
 18
18 -
 19
19 -
 20
20 -
 21
21 -
 22
22 -
23
-
24
-
25
-
26
-
27
-
28
-
29
-
30
-
31
-
32
-
33
-
34
-
35
-
36
-
37
-
38
-
39
-
40
-
41
-
42
-
43
-
44
 |
 |

additional
debt
discount
amortization resulting from the exercise
of
conversion rights
on
approximately
two-thirds
of
our
7.75% Convertible Notes.
Upon
conversion,
we
expensed S3.8 million
of
the
debt
discount
and
SO.5 million of
debt
issuance
costs
associated with
our
7.75% Convertible
Notes. A
summary
of
the
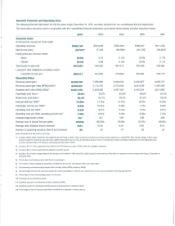
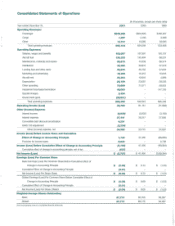
2001 special items, including where the
amounts
are recorded in
our
Consolidated
Statements
of
Operations, is listed below:
Description
Reduction
of
8737
and
OC-9
fleet values
and
lease termination charges (see
Note
13)
september
11th
special
charges
(see
Note
3)
Government
grant (see
Note
3)
Debt
discount
amortization (see
Note
7)
(In
millions)
Incomel(Expense)
Operating Nonoperating Total
$(46.1)
$-
$(46.1)
(2.5)
(25)
29.0
29.0
(4.3) (4.3)
$(19.6) $(4.3) $(23.9)
The
net
effect
of
these special
items
reduced
our
net
income
(loss) from S21.7million
to
$(2.8) million
and
reduced
our
earnings (loss) per
common
share from
$0.32
to
$(0.04).
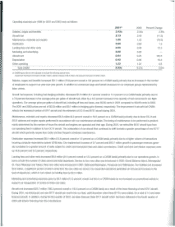
Operating
Revenues
Our
operating revenues for
the
year increased
$41.1
million (6.6 percent) primarily
due
to
an
increase in passenger revenues.
We
increased
our
capacity (available seat miles
or
ASMs)
by
11.6 percent
due
to
the continuation
of
our
fleet renewal
program
which resulted in the addition
of
14
8717
aircraft
and
the retirement
of
four
DC-9
and
four
8737
aircraft during the year.
Our
traffic (revenue passenger miles
or
RPMs) increased
by
9.5 percent
which
when
combined
with the increase
in
ASMs
resulted
in
a1.3 percentage point decline
in
our
passenger load factor.
Our
passenger yields also
declined
by
2.1
percent
to
14.39
cents
per RPM, which
in
conjunction with the higher traffic resulted in a
$43.7
million increase
in
our
passenger
revenues.
Cargo
revenues declined
by
$2.2
million during the year
due
to
the fact that
we
carried less mail for the U.S. Postal Service.
Our
financial results for the first eight
months
of 2001 were considerably different from those
of
the remainder
of
the year primarily
due
to
the impact
of
the
September
11
Events
on
our
passenger revenues. With the intent
of
providing a
more
meaningful understanding
of
this effect.
we
will further
discuss the 2001 results
in
two
time periods
as
follows: January through August,
and
September
through December.
For the period
of
January through August 2001, the slowing
of
the U.S.
economy
resulted initially in greater price awareness
by
air travelers followed
by
an
overall decline in the
demand
for air travel. This increased price awareness
tended
to
benefit
low
fare airlines during this time period,
as
demon-
strated
by
our
revenue performance. Despite anearly 18 percent increase in
capacity
during this period,
we
experienced even higher levels
of
passen-
ger
demand
which resulted in
our
load
factor increasing
by
1.7 percentage
points
over
the
same
period
in
the
previous year.
Our
passenger yields also
increased by 3.2 percent
to
15
cents
per
RPM. This resulted
in
our
passenger revenues increasing
by
S95.5 million over the comparable period
in
2000.
Our
passenger revenues for
the
period
from
September
through
December
2001 were significantly affected
by
the
September
11
Events. In response
to
the
terrorist attacks,
the
Federal Aviation Administration (FAA) immediately issued aFederal
ground
stop
order
on
september
11th,
which
prohibited
all
civil aviation nights from operation within the national airspace
of
the United States.
The
U.S. airspace
was
not
reopened until
September
13th,
at
which
time
we
resumed operating aportion
of
our
pre-September 11th scheduled operations.
Once
flights resumed, passenger traffIC
and
yields
were significantly
lower
than
we
had experienced prior
to
september
11th.
In
an
effort
to
match
our
capacity
to
the reduced level
of
demand,
we
reduced
our
operations
10
levels similar
to
those
we
operated during the
same
period in
2000,
despite
the fact that
we
had
been successful in
growing
our
capacity
by
18 percent earlier
in
the
year.
In addition,
many
corporations curtailed their business travel
and
leisure travelers cancelled
or
postponed
vacations,
which
forced airlines
to
reduce airfares
in
an
attempt
to stimulate
demand.
Despite these actions,
our
traffic
dropped
by
over
11
percent
which resulted in
our
passenger load factor declining eight percentage
points
compared
to
the previous year. Passenger yields also suffered
during
this
period
and
declined nearly 15 percent year-over-year. This resulted in a$51.8 million,
or
25
percent, decline in passenger revenues
compared
to
the
same
time
period
in
2000.
Operating
Expenses
Our
operating expenses increased
by
$86.5
million (15.9 percent)
on
an ASM increase
of
11.6 percent. Excluding the special items recognized during
2001 that are described above, our operating expenses increased
by
$66.9
million (12.3 percent). Operating
cost
per available seat mile (CASM),
excluding the special items, increased
0.6
percent from 9.27 cents
to
9.33
cents, primarily
due
to
the aircraft rent associated with the lease financing
of
agreater
number
of
aircraft
and
increased personnel costs.