Access America 2009 Annual Report Download - page 38
Download and view the complete annual report
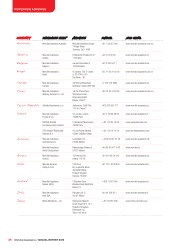
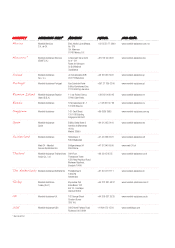
Please find page 38 of the 2009 Access America annual report below. You can navigate through the pages in the report by either clicking on the pages listed below, or by using the keyword search tool below to find specific information within the annual report.-
 1
1 -
2
-
3
-
4
-
5
-
6
-
7
-
8
-
9
-
10
-
11
-
12
-
13
-
14
-
15
-
16
-
17
-
18
-
19
-
20
-
21
-
22
-
23
-
24
-
25
-
26
-
27
-
 28
28 -
 29
29 -
 30
30 -
 31
31 -
 32
32 -
 33
33 -
 34
34 -
 35
35 -
 36
36 -
 37
37 -
 38
38 -
 39
39 -
 40
40 -
 41
41 -
 42
42
 |
 |

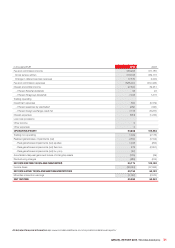
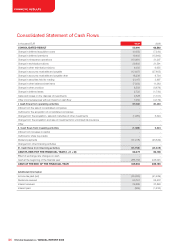
Consolidated Statement of Cash Flows
in thousand EUR 2009 2008
CONSOLIDATED RESULT 55,990 62,562
Change in deferred acquisition costs (4,435) (7,230)
Change in deferred premiums 19,403 (15,992)
Change in reinsurance operations (18,091) 31,207
Change in technical provisions 29,802 21,591
Change in other technical provisions 4,093 6,655
Change in accounts receivable and payable (12,627) (27,655)
Change in accounts receivable and payable other 18,236 9,734
Change in securities held for trading (2,017) 3,897
Change in other balance sheet items (7,933) 11,383
Change in other provision 8,559 (8,679)
Change in deferred taxes 2,722 (1,730)
Gains and losses on the disposal of investments 2,328 (1,101)
Other income/expenses without impact on cash fl ow 1,050 (4,179)
I. Cash fl ows from operating activities 97,080 80,463
Infl ows from the sale of consolidated companies - -
Outfl ows for the acquisition of consolidated companies - -
Change from the acquisition, sale and maturities of other investments (1,083) 5,324
Change from the acquisition and sale of investments for unit-linked life insurance - -
Other - -
II. Cash fl ows from investing activities (1,083) 5,324
Infl ows from increases in capital - -
Outfl ows for share buy-backs - -
Dividend payments (31,918) (25,649)
Change from other fi nancing activities - -
III. Cash fl ows from fi nancing activities (31,918) (25,649)
CASH FLOWS FOR THE FINANCIAL YEAR (I + II + III) 64,079 60,138
Effect of exchange rate changes on cash - -
Cash at the beginning of the fi nancial year 285,184 225,045
CASH AT THE END OF THE FINANCIAL YEAR 349,263 285,183
Additional information
Income tax paid (net) (35,033) (41,489)
Dividends received 50,701 52,572
Interest received 26,289 37,893
Interest paid (585) (1,233)
34 Mondial Assistance / ANNUAL REPORT 2009
FINANCIAL RESULTS